. 2006;5(4):11.
doi: 10.1186/jbiol36. Epub 2006 Jun 8.

Comprehensive curation and analysis of global interaction networks in Saccharomyces cerevisiae

Affiliations

Comprehensive curation and analysis of global interaction networks in Saccharomyces cerevisiae

Teresa Reguly et al. J Biol. 2006.

Abstract

Background: The study of complex biological networks and prediction of gene function has been enabled by high-throughput (HTP) methods for detection of genetic and protein interactions. Sparse coverage in HTP datasets may, however, distort network properties and confound predictions. Although a vast number of well substantiated interactions are recorded in the scientific literature, these data have not yet been distilled into networks that enable system-level inference.

Results: We describe here a comprehensive database of genetic and protein interactions, and associated experimental evidence, for the budding yeast Saccharomyces cerevisiae, as manually curated from over 31,793 abstracts and online publications. This literature-curated (LC) dataset contains 33,311 interactions, on the order of all extant HTP datasets combined. Surprisingly, HTP protein-interaction datasets currently achieve only around 14% coverage of the interactions in the literature. The LC network nevertheless shares attributes with HTP networks, including scale-free connectivity and correlations between interactions, abundance, localization, and expression. We find that essential genes or proteins are enriched for interactions with other essential genes or proteins, suggesting that the global network may be functionally unified. This interconnectivity is supported by a substantial overlap of protein and genetic interactions in the LC dataset. We show that the LC dataset considerably improves the predictive power of network-analysis approaches. The full LC dataset is available at the BioGRID (http://www.thebiogrid.org) and SGD (http://www.yeastgenome.org/) databases.

Conclusion: Comprehensive datasets of biological interactions derived from the primary literature provide critical benchmarks for HTP methods, augment functional prediction, and reveal system-level attributes of biological networks.


Figures
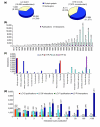
Figure 1
Figure 1
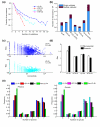
Characterization of the LC interaction dataset. (a) The total number of interactions in the LC dataset (left) and standard HTP datasets (right). Protein-protein interactions, blue; gene-gene interactions, yellow. (b) The number of publications that contain interaction data (red) and the number of interactions reported per year (light blue). (c) The number of interactions annotated for each experimental method. In this panel and all subsequent figures, each dataset is color coded as follows: LC-PI, blue; HTP-PI, red; LC-GI, aquamarine; HTP-GI, pink. (d) Number of interactions per publication in LC-GI and LC-PI datasets. Publications were binned by the number of interactions reported. The total number of papers and interactions in each bin is shown above each bar.
Figure 2
Figure 2
Validation of interactions within interaction datasets. (a) The fraction of interactions in each dataset supported by multiple validations (that is, different publications or types of experimental evidence). (b) The fraction of interactions in each indicated dataset supported by more than one publication or type of experimental evidence. (c) Better studied proteins or genes, as defined by the number of supporting publications relative to node connectivity (designated bias, see Materials and methods), tend to be more highly connected within the physical or genetic networks. (d) The study bias towards essential genes in each dataset. (e) The distribution of conserved proteins in interaction datasets. Frequency refers to fraction of the dataset in each bin. Orthologous eukaryotic clusters for seven standard species (Arabidopsis thaliana, Caenorhabditis elegans, Drosophila melanogaster, Homo sapiens, Saccharomyces cerevisiae, Schizosaccharomyces pombe, and Encephalitozoon cuniculi) were obtained from the COG database [96]. Sc refers to all budding yeast proteins as a reference dataset; non-LC refers to all HTP interactions except those that overlap with the LC datasets; X refers to yeast genes that were not assigned to any of the COG clusters and contains yeast-specific genes in addition to genes that have orthologs in only one of the other six species.
Figure 3
Figure 3
Distribution of GO terms for genes or proteins involved in genetic and physical interactions compared with genome-wide distribution. (a) Distribution of indicated GO cellular component, molecular function and biological process terms for nodes in each dataset. Sce refers to the distribution for all genes or proteins. (b) Fraction of interactions that share common GO terms in each of the three GO categories. High-level GO annotations (GO-Slim) were obtained from the SGD. The mean shared annotation is significantly higher for LC-PI than for HTP-PI for each of the three categories (Fisher's exact test, P < 1 × 10⁻¹⁰).
Figure 4
Figure 4
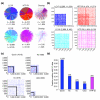
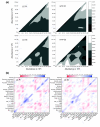
Intersection of LC and HTP datasets. (a) Datasets were rendered with the Osprey visualization system [65] to show overlap between indicated LC and HTP datasets. n, number of nodes; i, number of interactions. (b) Coverage in the HTP physical interaction dataset (collated from five major HTP studies: Uetz et al. [5], Ito et al. [6], Ito et al. [7], Gavin et al. [9], Ho et al. [8]) overlaps strongly with coverage in the LC dataset. Proteins present only in the LC dataset were labeled first, followed by proteins present only in the individual HTP datasets. In all plots, a dot represents interaction between proteins on the x- and y-axes. As the networks are undirected, plots are symmetric about the x = y line. Self interactions were removed. (c) Overlap of individual HTP datasets with the LC dataset. Dot plots show all interactions from each HTP dataset partitioned according to proteins that are present in the LC-PI dataset (inside the boxed region) and those that are not (outside the boxed region). 'Ito' indicates data from Ito et al. [7] rather than Ito et al. [7]. The protein content is different for each dataset and so ordinates are not superimposable. The number of overlapping interactions between each HTP dataset and the LC dataset is shown in parentheses. Note that only a small fraction of interactions in each boxed region actually overlaps with the LC-PI dataset because of the high false-negative rate in HTP data. (d) The number of LC interactions in HTP datasets.
Figure 5
Figure 5
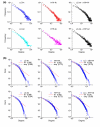
Scale-free degree distribution of physical and genetic interaction networks. (a) Frequency-degree plots of LC, HTP and combined networks. Degree is the connectivity (k) for each node, and frequency indicates the probability of finding a node with a given degree. The linear fit for each plot approximates a power-law distribution. (b) Rank-degree plots of LC, HTP, and combined networks. Each data point actually represents many nodes that have the same degree. The fit of the data to either linear (lin) or exponential (exp) curves is indicated for each plot and the coefficient of determination (R2) is reported in parentheses for each curve fit. Note that although the tail of each distribution exhibits a large deviation, only a small portion of the network is represented by the highly connected nodes in the tail region. For example, approximately 2% of nodes in the LC-PI and HTP-PI networks have connectivity greater than 30.
Figure 6
Figure 6
Connectivity of essential nodes. (a) Essential nodes tend to be more highly connected in the LC-PI and LC-GI networks. k is the measure of connectivity. (b) Essential-essential interactions are significantly enriched in the LC-PI and HTP-PI datasets but to a lesser extent in the LC-GI dataset. NN, nonessential-nonessential pairs; NE, nonessential-essential pairs, EE, essential-essential pairs. (c) The fraction of neighbors that are essential for LC-PI and HTP-PI networks. Only those nodes with connectivity greater than 3 were considered (n = 1,473 for LC-PI and n = 1,627 for HTP-PI). Compared with HTP-PI, a larger fraction of the immediate neighborhood of essential proteins in the LC-PI is composed of essential genes. (d) Clustering coefficient distribution for physical networks (top panel) and genetic networks (bottom panel). Average clustering coefficients and correlation coefficients were respectively: 0.53 and -0.56 for LC-PI, 0.38 and -0.54 for HTP-PI, 0.50 and -0.61 for LC-GI, 0.53 and -0.67 for HTP-GI. All correlations were computed using Spearman rank correlation and were statistically significant at P < 1e-100.
Figure 7
Figure 7
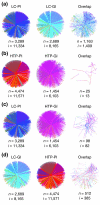
Overlap of physical and genetic interaction pairs. (a) Overlap between LC-PI and LC-GI datasets. (b) Overlap between HTP-PI and HTP-GI datasets. (c) Overlap between LC-PI and HTP-GI datasets. (d) Overlap between LC-GI and HTP-PI datasets.
Figure 8
Figure 8
Correlation of interactions with protein abundance and localization. (a) Statistical enrichment of interaction pairs as a function of protein abundance for each indicated dataset. Protein or gene pairs were separated into bins representing increasing protein abundance as derived from a genome-wide analysis [67] and shaded according to enrichment over chance distribution (the scale bar indicates the fraction of total interactions, with lighter regions indicating enrichment). Inf indicates infinity. Raw abundance distributions in each dataset are provided in Additional data file 3. (b) Correlation ratios of interactions between proteins of different locality for LC-PI and LC-GI networks. Blue regions in the diagonal indicate that interactions within the locality group are enhanced, while the off-diagonal red regions indicate that interactions of proteins from different localities are suppressed. Nodes with multiple localities were treated as missing values. Proteome-wide localization annotation [68] was available for 1,404 proteins (around 52%) in the LC dataset. The expected number of interactions was generated using 200 iterations of randomized versions of both original networks. Random networks were generated by an edge-swapping procedure, which maintains the degree-distribution, and localization assignments were shuffled among those nodes that had a single locality (the scale bar indicates fold enrichment over chance).
Figure 9
Figure 9
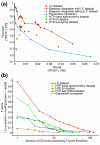
The LC dataset augments functional predictions. (a) Evaluation of curated literature against GO biological process as a standard. Comparisons of enrichment for functional relationships in LC dataset versus a variety of HTP datasets as scored against GO biological process are shown as the individual data points. The effect of the LC dataset on the predictive power of a Bayesian heterogeneous integration scheme [28] is shown by the curves. FN, false negatives; FP, false positives; TP, true positives. (b) Comparison of functional diversity in LC versus a variety of HTP datasets. The number of distinct functional groups (GO biological process terms) spanned by the LC dataset at decreasing levels of precision and recall. One hundred and forty-six independent GO terms were tested, all with fewer than 300 total annotations. A minimum F-score threshold (harmonic mean of precision and recall) was plotted against the number of GO terms needed to achieve that threshold for each of the data types.
Figure 10
Figure 10
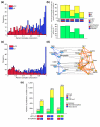
Interactions from the LC dataset dominate the composition of predicted protein complexes. (a) Contribution of HTP-PI and LC-PI data to predicted protein complexes. Each of the 420 predicted complexes are binned according to the percentage of LC (blue) or HTP (red) interactions it contains. The two distributions are not exact complements because some interactions are members of both LC-PI and HTP-PI. (b) The overlap of predicted protein complexes with actual protein complexes as defined by co-purification. For a predicted complex and a gold-standard complex, a hit is scored when the two sets of proteins produce a Jaccard similarity of ≥ 0.13. Top panel, green bars indicate the percentage of gold-standard complexes hit by some predicted complex. The sum of the green and yellow bars is the percentage of predicted complexes hit by some gold-standard complex. Bottom panel, the percentage of proteins in gold-standard complexes represented in all predicted complexes. This gives a rough upper bound on the percentage of gold-standard complexes that can be hit. (c) Complexes conserved between yeast and Drosophila are enriched in LC-PI interactions. This histogram is analogous to that shown for yeast-only complexes in Figure 10a. (d) Example of orthology between yeast and fly protein complexes in a cytoskeletal control network. The high degree of LC-PI interconnections between yeast proteins (orange) validates fly HTP interactions (blue) and suggests new potential connections to test between fly proteins. Thick lines indicate direct interactions, thin lines indicate interactions bridged by a common neighbor. Complex layouts were rendered in Cytoscape [97]. (e) Prediction of GO process annotations using conserved versus yeast-only complexes. Green bars indicate the number of correct predictions and yellow bars indicate the number of incorrect predictions, the sum of which is the total number of predictions. Complex and pathway prediction was carried out according to [31] and results were averaged over five rounds of full tenfold cross-validation.

Comment in

Similar articles

Cited by

References

    1. Chua G, Robinson MD, Morris Q, Hughes TR. Transcriptional networks: reverse-engineering gene regulation on a global scale. Curr Opin Microbiol. 2004;7:638–646. doi: 10.1016/j.mib.2004.10.009. - DOI - PubMed
    1. Giaever G, Chu AM, Ni L, Connelly C, Riles L, Veronneau S, Dow S, Lucau-Danila A, Anderson K, Andre B, et al. Functional profiling of the Saccharomyces cerevisiae genome. Nature. 2002;418:387–391. doi: 10.1038/nature00935. - DOI - PubMed
    1. Bader GD, Heilbut A, Andrews B, Tyers M, Hughes T, Boone C. Functional genomics and proteomics: charting a multidimensional map of the yeast cell. Trends Cell Biol. 2003;13:344–356. doi: 10.1016/S0962-8924(03)00127-2. - DOI - PubMed
    1. Jorgensen P, Breitkreutz BJ, Breitkreutz K, Stark C, Liu G, Cook M, Sharom J, Nishikawa JL, Ketela T, Bellows D, et al. Harvesting the genome's bounty: integrative genomics. Cold Spring Harb Symp Quant Biol. 2003;68:431–443. doi: 10.1101/sqb.2003.68.431. - DOI - PubMed
    1. Uetz P, Giot L, Cagney G, Mansfield TA, Judson RS, Knight JR, Lockshon D, Narayan V, Srinivasan M, Pochart P, et al. A comprehensive analysis of protein-protein interactions in Saccharomyces cerevisiae. Nature. 2000;403:623–627. doi: 10.1038/35001009. - DOI - PubMed

Publication types

MeSH terms

Substances

LinkOut - more resources