. 2006 Aug;17(8):3598-612.
doi: 10.1091/mbc.e06-01-0081. Epub 2006 Jun 7.

Dual loss of ER export and endocytic signals with altered melanosome morphology in the silver mutation of Pmel17

Affiliations

Dual loss of ER export and endocytic signals with altered melanosome morphology in the silver mutation of Pmel17

Alexander C Theos et al. Mol Biol Cell. 2006 Aug.

Abstract

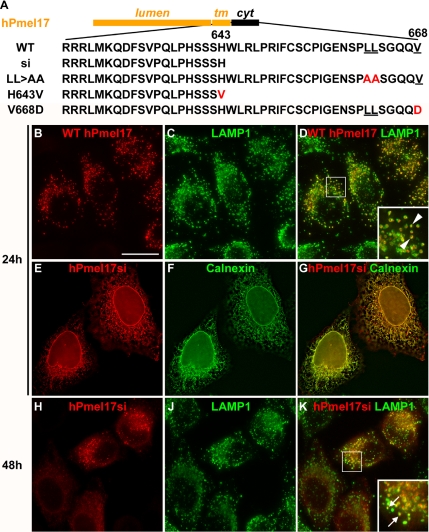
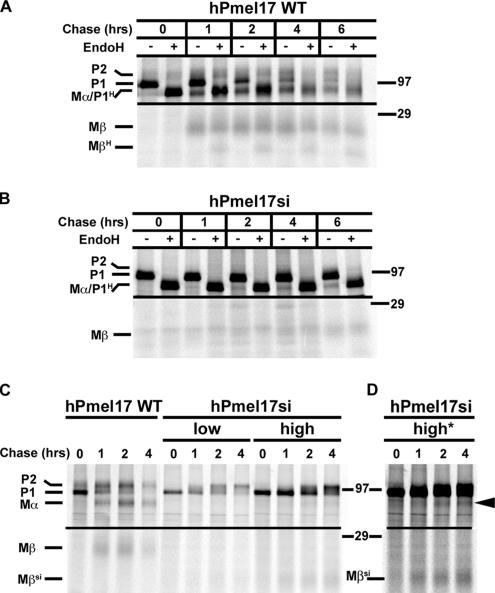
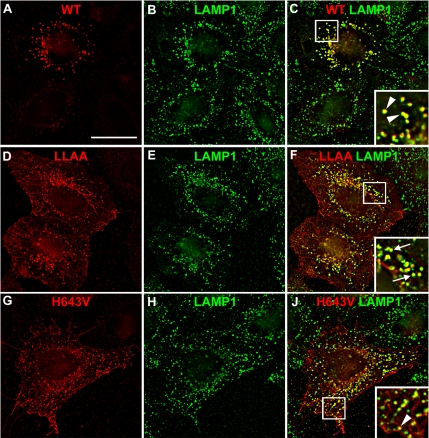
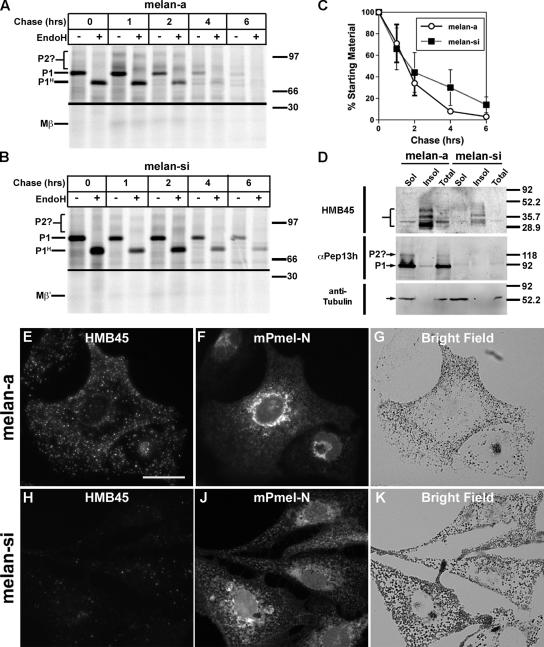
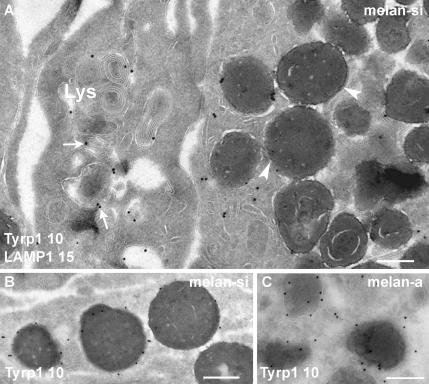
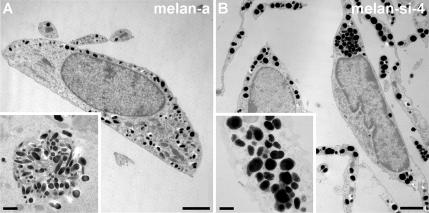
Pmel17 is a pigment cell-specific integral membrane protein that participates in the formation of the intralumenal fibrils upon which melanins are deposited in melanosomes. The Pmel17 cytoplasmic domain is truncated by the mouse silver mutation, which is associated with coat hypopigmentation in certain strain backgrounds. Here, we show that the truncation interferes with at least two steps in Pmel17 intracellular transport, resulting in defects in melanosome biogenesis. Human Pmel17 engineered with the truncation found in the mouse silver mutant (hPmel17si) is inefficiently exported from the endoplasmic reticulum (ER). Localization and metabolic pulse-chase analyses with site-directed mutants and chimeric proteins show that this effect is due to the loss of a conserved C-terminal valine that serves as an ER exit signal. hPmel17si that exits the ER accumulates abnormally at the plasma membrane due to the loss of a di-leucine-based endocytic signal. The combined effects of reduced ER export and endocytosis significantly deplete Pmel17 within endocytic compartments and delay proteolytic maturation required for premelanosome-like fibrillogenesis. The ER export delay and cell surface retention are also observed for endogenous Pmel17si in melanocytes from silver mice, within which Pmel17 accumulation in premelanosomes is dramatically reduced. Mature melanosomes in these cells are larger, rounder, more highly pigmented, and less striated than in control melanocytes. These data reveal a dual sorting defect in a natural mutant of Pmel17 and support a requirement of endocytic trafficking in Pmel17 fibril formation.


Figures

Figure 1.
Figure 1.
Cytoplasmic truncation of Pmel17 is inefficiently exported from the ER. (A) Schematic diagram of the lumenal, transmembrane (tm) and cytoplasmic (cyt) domains of hPmel. Primary sequences of cytoplasmic domains of WT hPmel (WT), hPmelsi (si), hPmel[LL>AA] (LL>AA), hPmelsi(H643V), and hPmel(V668D) are shown. Di-leucine and C-terminal valine residues are underlined and substitutions are highlighted in red. (B–K) IFM analysis of HeLa cells expressing WT hPmel and hPmelsi at 24 h (B–G) and 48 h (H–K) after transfection and colabeled for Pmel (with HMB-50; B, E, and H) and for LAMP-1 (C and J), or calnexin (F). (D, G, and K) Merged images. Insets in D and K, 2.5× magnification of the indicated regions. Structures colabeled for LAMP-1 and WT Pmel (D, arrowheads) or hPmelsi (K, arrows) are indicated. Bar, 20 μm.
Figure 2.
Figure 2.
hPmel17-si accumulates on the cell surface and can access MVBs in transfected HeLa cells. Ultrathin cryosections of HeLa cells expressing (A and B) WT hPmel or (C–E) hPmelsi were immunogold labeled with HMB-50 (PAG-10). Cells were analyzed 48 h (A–C, and E) or 24 h (D) after transfection. WT hPmel is detected nearly exclusively on internal membranes of multivesicular bodies (MVB; A and B) and dense fibrillar structures within them (arrows, B). Labeling for hPmelsi is found occasionally on internal membranes of multivesicular bodies (MVB; arrows, C) and more consistently on ER membranes (D) or at the plasma membrane (PM; arrowheads, E). Bars, 200 nm.
Figure 3.
Figure 3.
Maturation of hPmel17-si is delayed compared with WT. (A and B) HeLa cells expressing WT hPmel (A) and hPmelsi (B) were metabolically pulse-labeled and chased as indicated. Pmel isoforms were immunoprecipitated from cell lysates with lumenal-directed HMB-50 antibody, fractionated by SDS-PAGE with (+) or without (−) prior digestion with endoH, and analyzed by PhosphorImager. Top panels, regions surrounding P1, P2, and Mα (arrows; see text); bottom panels, regions surrounding Mβ; right, migration of molecular-weight markers. Note the appearance of Mβ after 1 h of chase for WT and its relative absence for hPmelsi. In this experiment, very little maturation of P1 to the Golgi-processed P2 isoform was observed for hPmelsi (representative of 6 independent experiments). (C and D) Similar to the experiment shown in A and B, except without EndoH treatment and using HeLa cells transfected with lower levels of WT hPmel and hPmelsi (low) as well as higher levels of hPmelsi (high). In this experiment, significant maturation of hPmelsi to the P2 isoform was observed at both low and high levels of expression, but was delayed compared with WT hPmel (representative of 5 independent experiments). (D) Overexposure of lanes in panel C (high*) containing hPmelsi expressed at high levels. The presence of products of proteolytic maturation, Mβsi and Mα (arrowhead), are evident at later chase time points.
Figure 4.
Figure 4.
C-terminal signals are required for efficient ER export of Pmel. (A) Schematic diagram of the domain structure of hPmel, Tac, and chimeric proteins TTP and TTPsi. Lumenal, transmembrane (tm), and cytoplasmic (cyt) domains of Tac and Pmel are indicated and are colored maroon and orange, respectively. (B) HeLa cells expressing TTP or TTPsi were metabolically pulse-labeled and chased as indicated. Polypeptides were immunoprecipitated from lysates with anti-Tac antibodies and fractionated by SDS-PAGE followed by PhosphorImager analysis. EndoH-sensitive precursor (P) and EndoH-resistant mature (M) forms are indicated. By 1 h of chase all of TTP has been modified to the M form, whereas the P form of TTPsi persists throughout the chase. (C–H) IFM analysis of HeLa cells expressing the H643V variant of the hPmelsi protein (C–E) or the V668D variant of full-length hPmel (F–H) colabeled for Pmel (with HMB-50) and the ER marker calnexin (D and G). (E and H) Merged images. Note the absence of coincidence between hPmel(H643V) and calnexin and the intense labeling of cell surface protrusions for Pmel (arrows) in E and the high degree of coincidence of hPmel(V668D) and calnexin in H. Bar, 20 μm. (J) HeLa cells expressing hPmel WT (WT), hPmelsi (si), hPmelsi(H643V), hPmel(V668D), and hPmel17[LL>AA] (LLAA) were metabolically pulse-labeled and chased as indicated. Isoforms were immunoprecipitated with HMB-50, fractionated by SDS-PAGE, and analyzed by PhosphorImager. Top panels, regions surrounding P1, P2, and Mα (arrows; see text); bottom panels, regions surrounding Mβand Mβsi; right, migration of molecular-weight markers.
Figure 5.
Figure 5.
Loss of the di-leucine motif is responsible for cell surface localization of hPmelsi. (A–J) IFM analysis of HeLa cells expressing hPmel WT (A–C), hPmel[LL>AA] (LLAA, D–F), and hPmelsi(H643V) (G–J). Cells were fixed and colabeled for Pmel (with HMB-50; A, D, G) and LAMP-1 (B, E, and H). Merged images are shown in C, F and J; insets, 2.5× magnification of indicated regions. Note that although hPmel[LL>AA] and hPmelsi(H643V) are observed at the cell surface, intracellular material localizes to LAMP-1–positive puncta like the WT protein (insets, arrows and arrowheads). Bar, 20 μm.
Figure 6.
Figure 6.
Surface accumulation of hPmelsi is due to an endocytosis defect. (A) HeLa cells were transfected with bicistronic plasmids encoding EGFP and hPmelwt (WT), hPmelsi (Si), hPmelsi(H643V) (H643V), or hPmel[LL>AA] (LLAA) or with a comparable empty vector (−). Cells were labeled on ice with NKI-beteb anti-Pmel and then PE-conjugated anti-mouse Ig. PE signal intensity corresponding to surface Pmel labeling is plotted against EGFP fluorescence intensity. (B) Cells gated for low but positive levels of EGFP fluorescence (see gate, panel A; chosen based on nonsaturating levels of WT Pmel, panel A) were analyzed for surface Pmel labeling, mean fluorescence intensity values were obtained, and all values were calculated relative to the mean value for WT Pmel within each experiment. Results from three independent experiments performed in triplicate are presented; error bars, SD. (C–M) HeLa cells expressing hPmel WT (WT; C and H), hPmelsi (si; D and J), hPmel[LL>AA] (LLAA; E and K), hPmel(V668D) (F and L) or hPmelsi(H643V) (G and M) were incubated on ice with HMB-50 antibody to label protein exposed on the cell surface. Cells were then washed and fixed either immediately (C–G) or after a 15-min incubation at 37°C (H–M), and analyzed by IFM with anti-mouse secondary antibodies. Note labeling for all constructs at the cell surface at 4°C (C–G) and only intracellular labeling for WT and V668D after 15 min at 37°C (H and L). Bar, 20 μm.
Figure 7.
Figure 7.
mPmel17si in silver mouse melanocytes is inefficiently sorted and expressed at low levels in melanosomes. (A and B) Immortalized melanocyte lines derived from WT (melan-a) and silver mice (melan-si-1; referred to here as melan-si) were metabolically pulse-labeled and chased as indicated. Endogenous protein was immunoprecipitated using αmPmel-N to the N-terminus of mPmel, subjected to mock (−) or endoH (+) digestion, and then fractionated by SDS-PAGE and analyzed by PhosphorImager. Top panels, regions surrounding P1, endoH-processed P1 (P1H), and potential P2 bands (P2?); bottom panels, regions surrounding Mβ and Mβ′ (representing small Mβ fragment derived from mPmelsi); right, migration of molecular-weight markers. Note that detection of processing intermediates for mPmel is not as consistent as for hPmel, and assignment of a band to P2 is more difficult. (C) Quantitation of mean P1 band intensity over time. Error bars, mean ± SD for 7 experiments for melan-a (○) and 5 experiments for melan-si (■). (D) Immunoblot analyses of melan-a and melan-si TX-100–soluble (Sol), TX-100–insoluble (Insol) fractions, and total cell lysates probed with anti-Pmel antibodies αPep13h (to the C-terminus of hPmel) or anti-tubulin as indicated. Migration of molecular-weight standards are shown on the right. The reduced intensity of the HMB-45–reactive bands in total cell lysates relative to SDS-solubilized TX-100–insoluble pellets is consistent and likely reflects inefficient recapture of the epitope in SDS from dilute whole cell lysates. Phosphorimaging analysis of both total cell lysates and Insol fractions show fivefold less HMB-45–reactive Pmel, relative to tubulin, in melan-si than in melan-a. (E–K). IFM analysis of melan-a (E–G) and melan-si-1 (H–K) cells. Cells were fixed, permeabilized, and costained with HMB-45 (E and H) and αmPmel-N (F and J). Images were all taken at the same exposure to illustrate the significant difference in fluorescence intensity of HMB-45 labeling in melan-a versus melan-si-1 (compare E with H). (E and H) The summation of a z-series; (F and J) single raw images from within this series. Corresponding bright field images are shown in G and K. Bar, 20 μm.
Figure 8.
Figure 8.
Surface accumulation of mPmel in silver melanocytes. (A–D) IFM analysis of unpermeabilized melan-a (A and B) and melan-si-1 (C and D) melanocytes labeled with αmPmel-N (A and C) to detect cell surface-exposed Pmel. Corresponding bright field images are shown in B and D. Bar, 20 μm. (E–H) melan-a (E and F) and melan-si-1 (G and H) cells were labeled with either polyclonal αPep13h as a negative control (thin line, −control) or αmPmel-N (thick line, Pmel) on ice and then anti-rabbit IgG-PE and analyzed by flow cytometry. (E and G) Forward scatter is plotted against side scatter for melan-a (E) and melan-si-1 (G) cells. The melan-si-1 cells are more homogeneous and display less forward scatter and greater granularity than melan-a cells because of their smaller size and greater degree of melanization. (F and H) PE fluorescence intensity is plotted against cell counts. Mean fluorescence intensity values are given for each sample. The increase in αmPmel-N staining in melan-si-1 compared with melan-a is thus ∼15–20-fold. Representative of three experiments.
Figure 9.
Figure 9.
Silver melanocytes are depleted of organized stage II and III melanosomes. (A) Ultrathin cryosections of melan-si-1 mouse melanocytes were labeled with antibodies to LAMP-1 (PAG-15) and the mature melanosome protein Tyrp1 (PAG-10). Note labeling for LAMP-1 within late endosomal membranes (arrows) and multilamellar lysosomes (Lys) and labeling for Tyrp1 on large, spherical mature melanosomes (arrowheads). (B and C) Ultrathin cryosections of melan-si-1 (B) and WT melan-a (C) mouse melanocytes were single-labeled for Tyrp1 (PAG-10). Note the presence of aberrant enlarged spherical densely melanized mature Tyrp1-positive melanosomes in melan-si-1 (B) compared with the smaller more ellipsoidal compartments in melan-a (C). Bars, 200 nm.
Figure 10.
Figure 10.
The aberrant melanosome morphology of silver is not due to the Tyrp1b/+ genotype. (A and B) Paraffin-embedded section of melan-a (WT control, A) and melan-si-4 (B) mouse melanocytes. Bars, 2 μm. Inset in A, magnification of melanosome clusters from melan-a containing organelles of different stages of melanosome development and inset in B, magnification of melan-si-4 melanosome cluster containing relatively fewer immature melanosomes. Note the larger size and more spherical geometry of the melanosomes from melan-si-4 compared with melan-a. Inset bars, 0.5 μm.

Similar articles

Cited by

References

    1. Adema G. J., de Boer A. J., Vogel A. M., Loenen W. A. M., Figdor C. G. Molecular characterization of the melanocyte lineage-specific antigen gp100. J. Biol. Chem. 1994;269:20126–20133. - PubMed
    1. Basrur V., et al. Proteomic analysis of early melanosomes: identification of novel melanosomal proteins. J. Proteome Res. 2003;2:69–79. - PubMed
    1. Bennett D. C., Cooper P. J., Hart I. R. A line of non-tumorigenic mouse melanocytes, syngeneic with the B16 melanoma and requiring a tumour promoter for growth. Int. J. Cancer. 1987;39:414–418. - PubMed
    1. Bennett D. C., Lamoreux M. L. The color loci of mice—a genetic century. Pigment Cell Res. 2003;16:333–344. - PubMed
    1. Berson J. F., Frank D. W., Calvo P. A., Bieler B. M., Marks M. S. A common temperature-sensitive allelic form of human tyrosinase is retained in the endoplasmic reticulum at the nonpermissive temperature. J. Biol. Chem. 2000;275:12281–12289. - PubMed

Publication types

MeSH terms