. 2006 Sep 15;108(6):2095-105.
doi: 10.1182/blood-2006-02-003327. Epub 2006 Jun 6.

Leukosialin (CD43) defines hematopoietic progenitors in human embryonic stem cell differentiation cultures

Affiliations

Leukosialin (CD43) defines hematopoietic progenitors in human embryonic stem cell differentiation cultures

Maxim A Vodyanik et al. Blood. .

Abstract

During hematopoietic differentiation of human embryonic stem cells (hESCs), early hematopoietic progenitors arise along with endothelial cells within the CD34(+) population. Although hESC-derived hematopoietic progenitors have been previously identified by functional assays, their phenotype has not been defined. Here, using hESC differentiation in coculture with OP9 stromal cells, we demonstrate that early progenitors committed to hematopoietic development could be identified by surface expression of leukosialin (CD43). CD43 was detected on all types of emerging clonogenic progenitors before expression of CD45, persisted on differentiating hematopoietic cells, and reliably separated the hematopoietic CD34(+) population from CD34(+)CD43(-)CD31(+)KDR(+) endothelial and CD34(+)CD43(-)CD31(-)KDR(-) mesenchymal cells. Furthermore, we demonstrated that the first-appearing CD34(+)CD43(+)CD235a(+)CD41a(+/-)CD45(-) cells represent precommitted erythro-megakaryocytic progenitors. Multipotent lymphohematopoietic progenitors were generated later as CD34(+)CD43(+)CD41a(-)CD235a(-)CD45(-) cells. These cells were negative for lineage-specific markers (Lin(-)), expressed KDR, VE-cadherin, and CD105 endothelial proteins, and expressed GATA-2, GATA-3, RUNX1, C-MYB transcription factors that typify initial stages of definitive hematopoiesis originating from endothelial-like precursors. Acquisition of CD45 expression by CD34(+)CD43(+)CD45(-)Lin(-) cells was associated with progressive myeloid commitment and a decrease of B-lymphoid potential. CD34(+)CD43(+)CD45(+)Lin(-) cells were largely devoid of VE-cadherin and KDR expression and had a distinct FLT3(high)GATA3(low)RUNX1(low)PU1(high)MPO(high)IL7RA(high) gene expression profile.


Figures
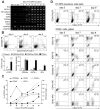
Figure 1.
Figure 1.
Kinetic analysis of hematopoietic development in H1/OP9 coculture. (A) Gene expression analysis of hematopoiesis-inductive transcription factors (SCL, GATA1) and hematoendothelial markers by RT-PCR. Triangular white pointers indicate the first day when a surface expression of respective hematopoietic markers was detected by flow cytometry. Dotted vertical lines show the timeframe of CFC emergence. Human- and mouse-specific GAPDH primers were used for positive control of human (hGAPDH) and MEF/OP9 (mGAPDH) RNA, respectively. (B) Early CD235a+CD34 cells in H1/OP9 coculture. Representative FACS analysis shows a burstlike CD235a expression and gradual emergence of CD34+CD235a+/– cells during 3 to 5 days of H1/OP9 coculture. Values within dot plots indicate percentage of cells in respective quadrants; 20 000 FACS events are displayed. Bar graphs show CFC potential and relative expression of CD235a, GATA-1, and SCL mRNA in FACS-sorted CD235aCD34, CD235a+CD34, and CD34+ cells on day 4 of H1/OP9 coculture. CFCs and mRNA levels were determined by MethoCult GF+ assay and qRT-PCR, respectively. The relative expression of each GAPDH-normalized target gene was calculated in comparison with undifferentiated H1 cells using the 2ΔΔCt method. Results are the mean ± SD from 3 independent experiments. (C) Expression of hematopoietic markers during H1/OP9 coculture was analyzed by FACS within gated CD34+ cells and represented as a percentage of CD34+ cells (left y-axis). Dashed trend line shows total CFC counts (right y-axis). Results are the means from 3 independent experiments. (D) Representative FACS analysis of CD43+ cells in H1/OP9 coculture. Values within dot plots indicate percentage of cells in respective quadrants; 20 000 (total H1/OP9 cells), 5000 (gated CD34+ cells, day 5), and 10 000 (gated CD34+ cells, days 7, 9) FACS events are displayed.
Figure 2.
Figure 2.
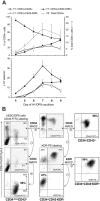
Developmental kinetics and sorting strategy of CD34+ subsets. (A) Kinetic analysis of CD34+ subsets in H1/OP9 coculture. Indicated CD34+ subsets were analyzed by FACS within gated CD34+ population and are represented on the top graph as percentage of CD34+ cells (left y1-axis). Total CD34+ cells (%) are depicted by dashed trend line (right y2-axis). The bottom graph shows absolute numbers of respective CD34+ subsets. Results are the mean ± SD from 4 independent experiments. (B) Flow diagram of multiparameter MACS separation of CD34+ subsets showing a FACS analysis of target cell populations throughout the sorting procedure (see “Materials and methods” for details). Positive and negative MACS fractions are indicated by arrows marked with + and – circles, respectively. Values within dot plots indicate percentage of cells in respective quadrants. The representative experiment is shown.
Figure 3.
Figure 3.
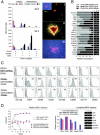
Hematopoietic and endothelial potential of CD34+ subsets. (A) CFC potential of MACS-sorted CD34+ subsets with indicated phenotype (+/– chart) was tested using MethoCult GF+ assay. Results are the mean ± SD from 9 independent experiments with H1 (n = 6) and H9 (n = 3) cells. NA indicates not applicable (subset was not detected/sorted). (B) qRT-PCR analysis of CD34+ subsets on day 6 of H1/OP9 coculture. The stacked bar graph shows expression levels of indicated transcripts represented by relative units (see “Materials and methods” for details). qPCR results are the means from 3 independent experiments. Representative agarose gel electrophoresis of qPCR products is shown. (C) Endothelial culture of CD34+ subsets isolated on day 6 of H1/OP9 coculture. Photographs show 5-day culture of indicated CD34+ subsets in endothelial conditions (scale bar represents 50 μm). Insets show VE-cadherin expression (scale bar represents 50 μm). VE-cadherin was stained by anti–VE-cadherin antibody (goat IgG; R&D Systems, Minneapolis, MN) followed by anti–goat IgG–Alexa Fluor-488 conjugate (green fluorescence; Molecular Probes). Cell nuclei were visualized by DAPI staining (blue fluorescence). Images were captured with an inverted DMIRB microscope (Leica Microsystems) equipped with a 20×/0.3 objective lens, and were acquired through MagnaFire camera and software (Optronics). Fluorescent images were composed using Adobe Photoshop software (Adobe Systems, San Jose, CA). The representative experiment is shown. Identical results were obtained with CD34+ subsets isolated on day 9 (H1, H9) and day 6 (H9). (D) Wright-stained cytospins of CD34+ subsets isolated on day 9 of H1/OP9 coculture (scale bar represents 10 μm). Images were captured with a Microphot-SA microscope (Nikon, Melville, NY) equipped with a 100×/1.40 oil-immersion objective lens, and were acquired through a DFC320 camera and Firecam 1.3 software (Leica Microsystems). (E) CD34+CD43 KDR+ cells isolated on day 5 of H1/OP9 coculture were cultured 6 days with fresh OP9 cells (i) or without feeder cells (ii) in StemSpan serum-free medium (StemCell Technologies) supplemented with 2% FBS (HyClone Laboratories), Ex-Cyte (1/500; Serological, Norcross, GA), 10 ng/mL bFGF, 50 ng/mL SCF, 10 ng/mL TPO, 20 ng/mL IL-6. Central endothelial clusters (ECs) surrounded by proliferating hematopoietic clusters (HCs) were observed in coculture with OP9 cells (i; scale bar represents 100 μm). Similar hematoendothelial colonies were formed in feeder-free cultures (ii; scale bar represents 50 μm); bright-field (left panel) and fluorescent (right panel) photographs show the same colony stained with anti-CD43 mAb (BD Pharmingen, San Diego, CA) and anti–VE-cadherin antibody (goat IgG; R&D Systems) followed by anti–mouse IgG–Alexa Fluor-488 (green fluorescence) and anti–goat IgG–Alexa Fluor-555 conjugates (red florescence; Molecular Probes). Images captured with an inverted DMIRB microscope (Leica Microsystems) equipped with a 10×/0.25 (i) or a 20×/0.3 (ii) objective lens, and were acquired with a MagnaFire camera and software (Optronics). Note a clear separation of the hematopoietic and endothelial cells by CD43 staining: all rounded hematopoietic cells are CD43+, but adherent VE-cadherin+ endothelial cells are CD43.
Figure 4.
Figure 4.
Endothelial phenotype and function of CD34+CD43KDR+ cells isolated after 6 days of H1/OP9 coculture. (A) FACS analysis of KDR+ and KDR fractions of CD34+CD43 cells isolated on day 9 of H1/OP9 coculture. Phenotype of CD34+CD43 KDR cells was compared with phenotype of CD34CD43 cells obtained after depletion of CD34+ and CD43+ cells. Plots show isotype control (open) and specific mAb (tinted) histograms. Values within plots indicate specific mean fluorescence intensity (ΔMFI) calculated by formula: linear-scaled MFI of specific mAb-stained cells – linear-scaled MFI of isotype control mAb-treated cells. The representative experiment is shown. Similar results were obtained in 5 independent experiments with H1- and H9-derived CD34+CD43KDR+/– cells isolated on day 6 (n = 2) and day 9 (n = 3) of differentiation. (B) CD34+CD43KDR+ cells were cultured 7 days in endothelial expansion conditions and examined for markers of mature endothelial cells. Immunofluorescent staining was performed with primary antibodies against VE-cadherin (goat IgG; R&D Systems), von Willebrand factor (VWF; rabbit IgG; Sigma) and endothelial NO synthetase (eNOS; mouse IgG1; BD Pharmingen) followed by respective secondary antibody against goat IgG-Alexa Fluor-555 (red fluorescence), rabbit IgG-Alexa Fluor-488 (green fluorescence), and mouse IgG-Alexa Fluor-488 (Molecular Probes). Negative controls were done using appropriate primary IgG controls (Sigma). Cell nuclei were visualized by DAPI staining (blue fluorescence). Images were captured with an inverted DMIRB microscope (Leica Microsystems) equipped with a 20×/0.3 objective lens, and were acquired with a MagnaFire camera and software (Optronics). Fluorescent images were composed using Adobe Photoshop software. Ac-LDL uptake was assessed by incubation with DiI-Ac-LDL conjugate as described in “Materials and methods.” Scale bar represents 50 μm. Insets show FACS analysis of respective surface (VE-cadherin) and intracellular (eNOS, VWF) markers in parallel cultures, or instant FACS profiles of cells incubated with DiI-Ac-LDL at 37°C (Ac-LDL uptake) versus 4°C (control Ac-LDL binding). (C) Vascular tubes formation by CD34+CD43 KDR+ cells (scale bar represents 200 μm, left panel; and 50 μm, right panel). Images were captured with an inverted DMIRB micrscope (Leica Microsystems) equipped with a 5×/0.12 (left) or 20×/0.3 (right) objective lens, and were acquired through a MagnaFire camera and software (Optronics). (D) TNF-induced up-regulation of ICAM-1 and induction of VCAM-1 expression in CD34+CD43KDR+ endothelial cultures. Numbers within plots indicate ΔMFI values for untreated (blue) and TNF-treated (red) cells. VLA-4 staining was used as a control. A representative example of 3 independent experiments is shown.
Figure 5.
Figure 5.
CD43+ cell subsets: definition, kinetic profile, sorting and morphology. (A) The phenotype of CD43+ cells isolated on day 8 of H1/OP9 coculture. CD41a and CD235a were coexpressed (bottom left dot plot), and both in opposite manner to CD45 (top dot plots). Combination of CD41a-PE, CD235a-PE, and CD45-APC mAbs (bottom right dot plot) defines 3 major CD43+ subsets: (1) CD43+CD41a/CD235+CD45, (2) CD43+CD41a/CD235aCD45, and (3) CD43+CD41a/CD235a CD45+. Values within plots indicate percentage of cells in respective quadrants. Representative analysis is shown. (B) Kinetic analysis of indicated CD43+ subsets in H1/OP9 coculture represented as percentage of total CD43+ cells (left y1-axis). Dashed trend lines show parallel kinetics of indicated CFC types (right y2-axis). Results are the mean ± SD from 3 independent experiments. (C) Sorting strategy used for isolation of CD43+ subsets. A representative example of 7 independent experiments is shown (H1, n = 5; H9, n = 2). (D) Wright-stained cytospins of FACS-sorted CD43+ subsets (scale bar represents 5 μm). Images were captured with a Microphot-SA microscope (Nikon, Melville, NY) equipped with a 100×/1.40 oil-immersion objective lens, and were acquired through a DFC320 camera and Firecam 1.3 software (Leica Microsystems).
Figure 6.
Figure 6.
Phenotypic and functional analysis of CD43+ subsets. (A) CFC potential of FACS-sorted CD43+ subsets on day 6 and day 9 of hESC/OP9 cocultures. CFC-E/Mks and CFC-GEMM/GM/Ms were determined by serum-free MegaCult collagen assay and FBS-containing MethoCult GF+ methylcellulose assay, respectively. Results are the mean ± SD from 9 independent experiments (H1, n = 6; H9, n = 3). NA indicates not applicable (subset was not detected/sorted). Photographs show typical E and small Mk colonies detected in CD43+CD41a/CD235a+CD45–/+ subsets (i, scale bar represents 200 μm; inset shows Mk colony stained with anti-CD41a mAb, scale bar represents 50 μm) and multilineage GEMM (ii, scale bar represents 200 μm) and large Mk colonies (iii, scale bar represents 50 μm) detected in CD43+CD41a/CD235aCD45–/+ subsets. Images were captured with an inverted DMIRB microscope (Leica Microsystems) equipped with a 5×/0.12 (i-iii) or a 20×/0.3 (inset) objective lens, and were acquired with a MagnaFire camera and software (Optronics). (B) qRT-PCR analysis of FACS-sorted CD43+ subsets on day 8 of H1/OP9 coculture. The stacked bar graph shows expression levels of indicated transcripts represented by relative units (see “Materials and methods” for details). Results are the means of 2 independent experiments. Representative agarose gel electrophoresis of qPCR products is shown. (C) FACS analysis of CD43+ subsets. CD43+ cells were isolated on day 8 of H1/OP9 coculture by direct CD43 MACS microbeads. Color-matching combinations of CD43, CD41a, CD235a, CD45, and indicated mAbs were used for CD43+ subset gating and analysis. Plots show isotype control (open) and specific mAb (tinted) histograms. Values within plots indicate ΔMFI values. Representative analysis of 3 independent experiments is shown. (D) Lymphoid and myeloid differentiation of FACS-sorted CD43+ subsets in coculture with MS-5 stromal cells. CD43+ subsets were isolated on day 8 of hESC/OP9 cocultures and cultured with MS-5 cells in presence of cytokines supporting either lymphoid or myeloid differentiation (see “Materials and methods” for details). Lymphoid MS-5 cultures were examined for expression of NK cell (CD3E, CD3Z) and B-cell (MB1, VPREB, PAX5) specific transcripts by qRT-PCR on the fourth week of culture. The relative expression of each GAPDH-normalized target gene was calculated in comparison with isolated CD43+ cells before coculture (MB1, very low levels of CD3E/Z, but no detectable VPREB and PAX5 were found in CD43+ cells before coculture). Results are the mean ± SD from 3 independent experiments with H1 (n = 2) and H9 (n = 1) cells. A representative agarose gel of qPCR products is shown. Myeloid MS-5 cocultures were examined for total CD43+ cells and myeloid CFCs (GM/M) during 6 weeks of culture. Results are the means ± SD from 4 independent experiments (H1, n = 2; H9, n = 2).
Figure 7.
Figure 7.
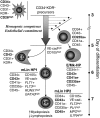
A model of hematoendothelial differentiation in hESC/OP9 coculture. Hematopoietic and endothelial cells develop from early precursors identified by a CD34+KDR+(CD43) phenotype. These precursors appear at day 3 of differentiation and retain hematoendothelial potential up to day 5, but after 6 days, CD34+CD43 KDR+ cells constitute a population of committed endothelial cells (ECs). CD43 is identified as a specific marker of early hematopoietic progenitors. Two types of CD43+ hematopoietic progenitors are identified in hESC/OP9 coculture: (1) CD43+CD41a/CD235a+ erythro-megakaryocytic progenitors (E/Mk-HP) first detectable on day 4 of differentiation, and (2) CD43+CD41a/CD235a multilineage (mLin) progenitors (HP1) appeared 2 days later. Emergence of E/Mk-HP before mLin HP1 and residual expression of VE-cadherin, FLT1, and CD105 endothelial markers by HP1 cells may reflect a step-wise endothelial commitment of CD34+KDR+ hematoendothelial precursors (block arrow): CD34+KDR+ precursors at initial pre-endothelial commitment stage are only competent to generate E/Mk-HP through CD235+ intermediates, whereas multipotent HP1 are derived from CD34+KDR+ precursors with an endothelial phenotype (VE-cadherinhighCD105high). HP1 have lymphomyeloid potential and a gene expression profile found in the most immature hematopoietic progenitors. HP1 transition to CD45+ stage (HP2) is associated with progressive myeloid commitment and a decrease of lymphoid potential. CD34+CD43KDRCD26high cells arise along with the first CD34+KDR+ cells and may comprise more than 20% of total CD34+ cells in hESC/OP9 cocultures. These cells are devoid of detectable hematoendothelial potential.

Similar articles

Cited by

References

    1. Godin I, Cumano A. The hare and the tortoise: an embryonic haematopoietic race. Nat Rev Immunol. 2002;2: 593-604. - PubMed
    1. Tavian M, Zheng B, Oberlin E, et al. The vascular wall as a source of stem cells. Ann N Y Acad Sci. 2005;1044: 41-50. - PubMed
    1. Li W, Ferkowicz MJ, Johnson SA, Shelley WC, Yoder MC. Endothelial cells in the early murine yolk sac give rise to CD41-expressing hematopoietic cells. Stem Cells Dev. 2005;14: 44-54. - PubMed
    1. Jaffredo T, Bollerot K, Sugiyama D, Gautier R, Drevon C. Tracing the hemangioblast during embryogenesis: developmental relationships between endothelial and hematopoietic cells. Int J Dev Biol. 2005;49: 269-277. - PubMed
    1. Fraser ST, Ogawa M, Yu RT, Nishikawa S, Yoder MC. Definitive hematopoietic commitment within the embryonic vascular endothelial-cadherin(+) population. Exp Hematol. 2002;30: 1070-1078. - PubMed

Publication types