. 2006 Jun;80(12):5723-32.
doi: 10.1128/JVI.00025-06.

Regulation of Epstein-Barr virus latency type by the chromatin boundary factor CTCF

Affiliations

Regulation of Epstein-Barr virus latency type by the chromatin boundary factor CTCF

Charles M Chau et al. J Virol. 2006 Jun.

Abstract

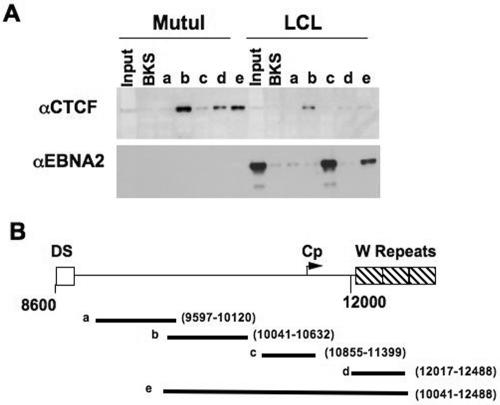
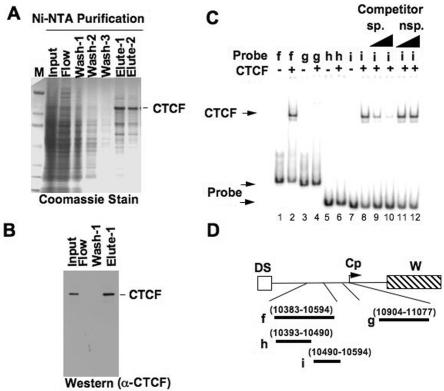
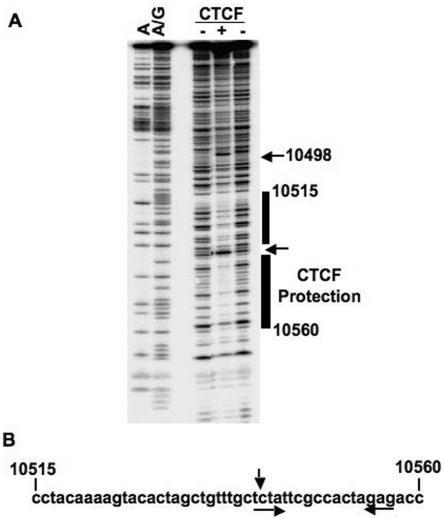
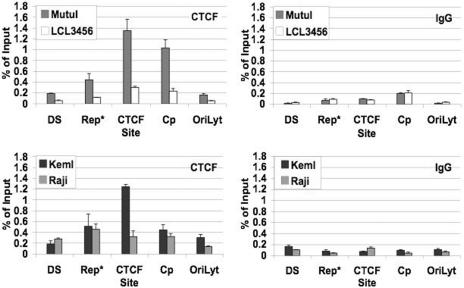
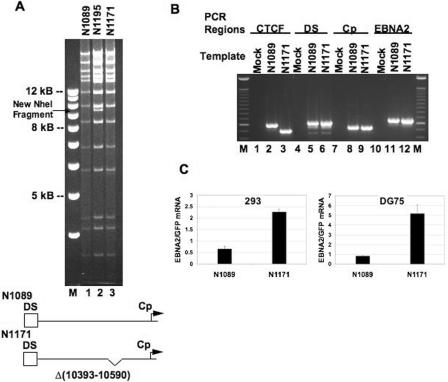
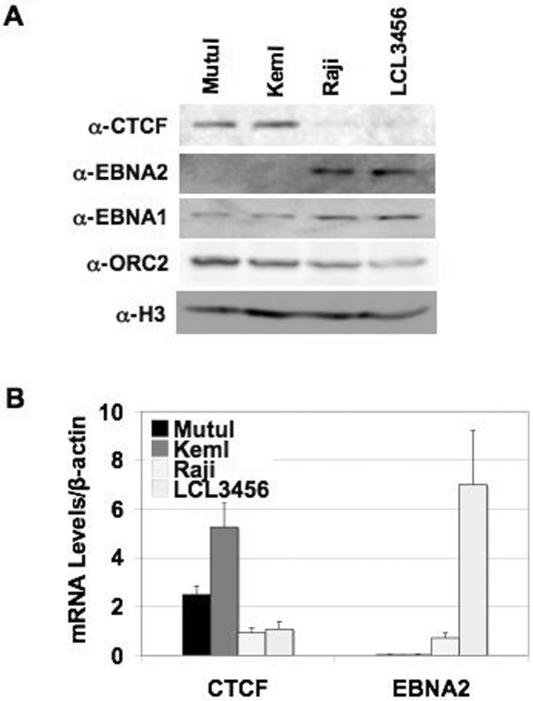
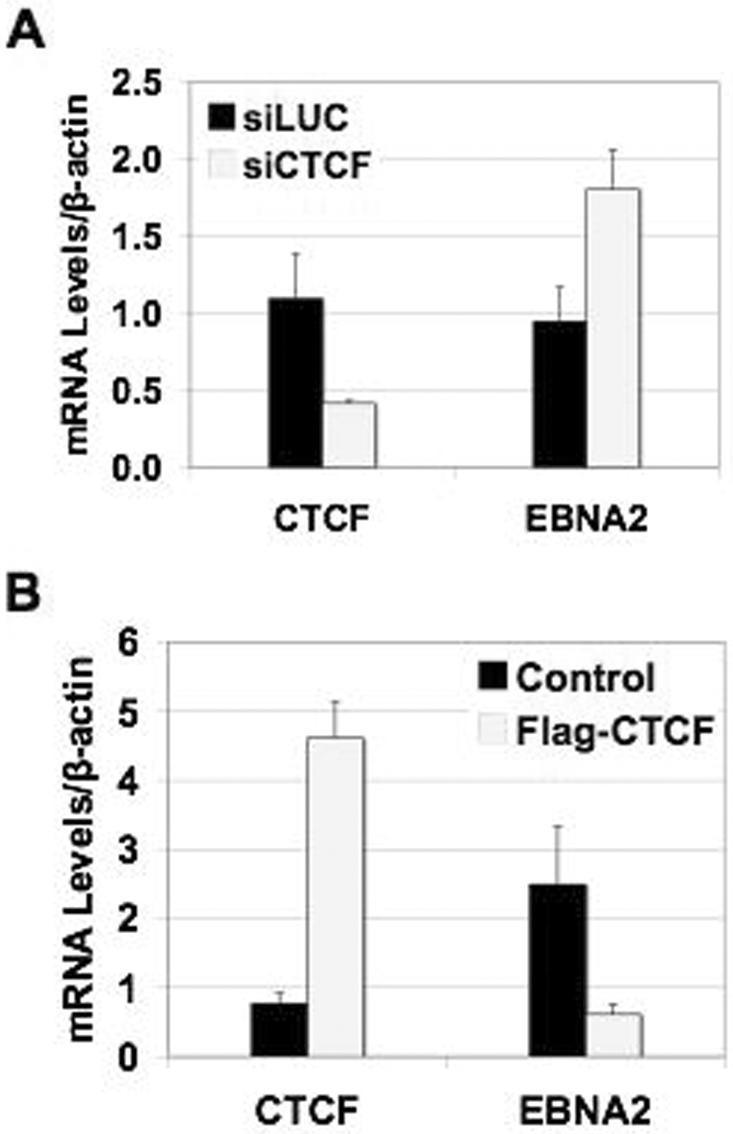
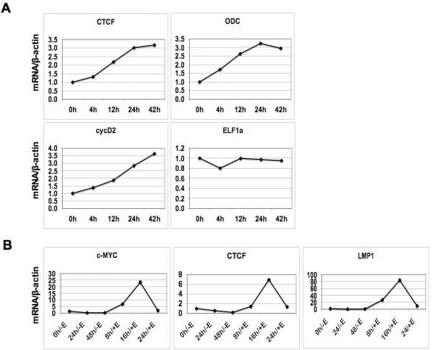
Epstein Barr virus (EBV) can establish distinct latency types with different growth-transforming properties. Type I latency and type III latency can be distinguished by the expression of EBNA2, which has been shown to be regulated, in part, by the EBNA1-dependent enhancer activity of the origin of replication (OriP). Here, we report that CTCF, a chromatin boundary factor with well-established enhancer-blocking activity, binds to EBV sequences between the OriP and the RBP-Jkappa response elements of the C promoter (Cp) and regulates transcription levels of EBNA2 mRNA. Using DNA affinity, electrophoretic mobility shift assay, DNase I footprinting, and chromatin immunoprecipitation (ChIP), we found that CTCF binds both in vitro and in vivo to the EBV genome between OriP and Cp, with an approximately 50-bp footprint at EBV coordinates 10515 to 10560. Deletion of this CTCF binding site in a recombinant EBV bacterial artificial chromosome (BAC) increased EBNA2 transcription by 3.5-fold compared to a wild-type EBV BAC. DNA affinity and ChIP showed more CTCF binding at this site in type I latency cell lines (MutuI and KemI) than in type III latency cell lines (LCL3456 and Raji). CTCF protein and mRNA expression levels were higher in type I than type III cell lines. Short interfering RNA depletion of CTCF in type I MutuI cells stimulated EBNA2 mRNA levels, while overexpression of CTCF in type III Raji cells inhibited EBNA2 mRNA levels. These results indicate that increased CTCF can repress EBNA2 transcription. We also show that c-MYC, as well as EBNA2, can stimulate CTCF mRNA levels, suggesting that CTCF levels may contribute to B-cell differentiation as well as EBV latency type determination.


Figures

FIG. 1.
FIG. 1.
DNA affinity pull-down of CTCF and EBNA2 with EBV DNA. (A) Western blots of CTCF and EBNA2 binding to different biotinylated DNA fragments of EBV using nuclear extracts from MutuI (type I EBV-positive cell line) and LCL3456 (type III EBV-positive cell line). Inputs represent 10% of total nuclear proteins used for DNA affinity. BKS is a random biotinylated DNA fragment of pBluescript KS+. Fragments a to e represent DNA affinity using different DNA segments of EBV encompassing a region between the DS and W repeats of EBV. αCTCF and αEBNA2, anti-CTCF and anti-EBNA2 antibodies, respectively. (B) Schematic diagram of the different DNA segments of EBV used in the DNA affinity assay. The segments are labeled a to e, and the regions of EBV covered by each segment are labeled with its EBV coordinates.
FIG. 2.
FIG. 2.
Electrophoretic mobility shift assay of CTCF with EBV DNA. (A) Coomassie gel of Ni-NTA purification of His-tagged CTCF expressed in Sf9 insect cells. Sf9 cell extracts expressing His-tagged CTCF were loaded onto Ni-NTA beads, washed with 20 mM imidazole buffer, eluted with 250 mM imidazole elution buffer, and dialyzed in PBS containing 20% glycerol. (B) Western blot of His-tagged CTCF. Different fractions of proteins during the purification process were electrophoresed on an 8 to 16% SDS-PAGE gel, transferred onto nitrocellulose membrane, and probed using a rabbit polyclonal anti-CTCF antibody (α-CTCF). (C) Autoradiogram of in vitro EMSA showing CTCF shifting of EBV DNA probes. Purified His-tagged CTCF was used for gel shift of various EBV 32P-labeled DNA probes. Lanes 1 and 2 represent EMSA with probe f, lanes 3 and 4 are EMSA with probe g, lanes 5 and 6 are EMSA with probe h, and lanes 7 to 12 are EMSA with probe i. Lanes 9 to 12 represent EMSA with specific (sp.) and nonspecific (nsp.) cold DNA competitors at 10- and 100-fold excess. (D) Schematic diagram of various EBV DNA probes used in EMSA. The probes cover regions upstream of the C promoter, between EBV coordinates 10383 to 10594 and 10904 to 11077.
FIG. 3.
FIG. 3.
DNase I footprinting of CTCF on EBV DNA. (A) Autoradiogram of in vitro DNase I footprinting gel showing CTCF protection on EBV DNA probe. Purified His-tagged CTCF was used for footprinting assay using EBV 32P-labeled DNA probe covering EBV coordinates 10393 to 10594. Nucleotide ladders A and A/G were generated by chemical cleavage using the Maxim-Gilbert method. For the CTCF lanes, + indicates prominent CTCF protection from DNase I digestion from EBV coordinates 10515 to 10560, whereas − lanes (no-CTCF controls) show no protection at the same region. The arrows indicate DNase I-hypersensitive sites. (B) Sequence of EBV protected by CTCF in DNase I footprinting assay. CTCF protection covers a DNA sequence from EBV coordinates 10515 to 10560. The top arrow indicates a DNase I-hypersensitivity site. The two bottom arrows show a possible inverted repeat.
FIG. 4.
FIG. 4.
ChIP of CTCF at various EBV sites in multiple EBV-positive cell lines. Results of real-time PCR analysis of ChIP assay with antibody specific to CTCF or control IgG are shown for type I EBV-positive cell lines (MutuI and KemI) and two type III EBV-positive cell lines. The EBV regions analyzed for CTCF binding are as follows: DS (primers covering EBV coordinates 8957 to 9043), Rep* (primers covering 9715 to 9793), CTCF site (primers covering 10401 to 10487), Cp (primers covering 10956 to 11030), and OriLyt (primers covering 52,654 to 52,797). Samples were analyzed in triplicate.
FIG. 5.
FIG. 5.
Differences in EBNA2 transcription level in wild-type EBV BAC and EBV BAC with CTCF binding site deletion. (A) Gel of NheI restriction enzyme digestion patterns of recombinant EBV BACs. N1089 represents the wild-type EBV BAC. N1195 is the wild-type EBV BAC after homologous recombination with a PCR fragment containing a kanamycin resistance marker flanked by Floxed P sites and 50 bp of EBV DNA spanning the CTCF binding site. A new NheI fragment is generated by insertion of the PCR product. N1171 is the EBV BAC generated after Cre-Lox recombination to obtain a CTCF site deletion spanning EBV coordinates 10393 to 10590. Each EBV BAC DNA was cut with NheI, electrophoresed on a 0.7% agarose gel, and stained with ethidium bromide. Below the gel, a schematic diagram of N1089 and N1171 illustrates the deletion generated in the EBV BAC. (B) PCR analysis of EBV BACs. DNAs from N1089 and N1171 and distilled water (Mock) were amplified by PCR using primers to various EBV regions. The following PCR regions were analyzed: CTCF binding site (covering EBV coordinates 10041 to 10632), DS (8587 to 9206), Cp (10855 to 11399), and the EBNA2 coding region (48504 to 49131). (C) RT-PCR of EBNA2 in wild-type EBV BAC (N1089) and EBV BAC with CTCF binding site deletion (N1171). N1089 and N1171 EBV BACs were transfected into 293 (left panel) or DG75 (right panel) cells. The cells were harvested 72 h later, and real-time RT-PCR was performed. EBNA2 mRNA levels were normalized to GFP. Samples were analyzed in triplicate.
FIG. 6.
FIG. 6.
Differences in CTCF protein levels in MutuI, KemI, Raji, and LCL3456. (A) Western blots of CTCF, EBNA2, EBNA1, Orc2, and histone H3 in different EBV-positive cell lines. Total cell lysates from MutuI (type I), KemI (type I), Raji (type III), and LCL3456 (type III) cells were loaded on an 8 to 15% SDS-PAGE gel, transferred to nitrocellulose membrane, and probed with antibodies specific to CTCF, EBNA2 and EBNA1, Orc2, and histone H3. (α-CTCF, α-EBNA2 and α-EBNA1, α-ORC2, and α-H3, respectively) (B) RT-PCR of CTCF and EBNA2 mRNA levels in different EBV-positive cell lines. Cells (MutuI, KemI, Raji, and LCL3456) were collected at logarithmic growth phase (5 × 105 to 7.5 × 10⁵ cells/ml) for real-time RT-PCR. CTCF and EBNA2 mRNA levels were normalized to β-actin. Samples were analyzed in triplicate.
FIG. 7.
FIG. 7.
Regulation of EBNA2 transcription by CTCF. (A) RT-PCR analysis of EBNA2 mRNA levels after depletion of CTCF in type I MutuI cells. MutuI cells were cotransfected with GFP and siRNA against CTCF or luciferase (control) using nucleofection. After 48 h, cells were sorted for GFP expression. GFP-positive cells were collected and allowed to grow for another 24 h. GFP-positive cells were then harvested for RT-PCR. EBNA2 and CTCF mRNA levels were analyzed by real-time PCR and normalized to β-actin. Samples were analyzed in triplicate. (B) RT-PCR analysis of EBNA2 mRNA levels after overexpression of CTCF in type III Raji cells. Raji cells were transfected with either Flag-CTCF vector or the control (Flag vector) using double nucleofections. After 48 h, cells were harvested for RT-PCR. EBNA2 and CTCF mRNA levels were analyzed by real-time PCR and normalized to β-actin. Samples were analyzed in triplicate.
FIG. 8.
FIG. 8.
Correlations between CTCF, c-MYC, and EBNA2 levels. (A) RT-PCR of MYC-ER induction time course using IMR-90-MYC-ER cells. Cells were collected at 0, 2, 4, 8, 24, and 42 h after induction with 200 nM 4-OHT. CTCF, ODC, cycD2, and ELF1α mRNA levels were analyzed by real-time PCR and normalized to β-actin. Samples were analyzed in triplicate. (B) RT-PCR of EBNA2-ER induction time course using EREB 2.5 cells. EREB 2.5 cells were grown to a density of 5 × 10⁵ to 7.5 × 10⁵ cells/ml in 1 μM β-estradiol. Then, β-estradiol was removed from the cells by placing the cells in fresh, complete RPMI 1640 medium without β-estradiol. Samples were then collected at 0, 24, and 48 h after β-estradiol removal (time points labeled as −E). After 48 h without β-estradiol, the cells were then resuspended in fresh, complete RPMI 1640 medium with 1 μM β-estradiol at a density of 5 × 10⁵ to 7.5 × 10⁵ cells/ml. Cells were collected at 8, 12, and 24 h after addition of 1 μM β-estradiol (time points labeled as +E). CTCF, c-MYC, and LMP1 mRNA levels were analyzed by real-time PCR and normalized to β-actin. All samples were done in triplicate.

Similar articles

Cited by

References

    1. Alazard, N., H. Gruffat, E. Hiriart, A. Sergeant, and E. Manet. 2003. Differential hyperacetylation of histones H3 and H4 upon promoter-specific recruitment of EBNA2 in Epstein-Barr virus chromatin. J. Virol. 77:8166-8172. - PMC - PubMed
    1. Ambinder, R. F., K. D. Robertson, and Q. Tao. 1999. DNA methylation and the Epstein-Barr virus. Semin. Cancer Biol. 9:369-375. - PubMed
    1. Atanasiu, C., L. Lezina, and P. M. Lieberman. 2005. DNA affinity purification of Epstein-Barr virus OriP-binding proteins. Methods Mol. Biol. 292:267-276. - PubMed
    1. Babcock, G. J., D. Hochberg, and A. D. Thorley-Lawson. 2000. The expression pattern of Epstein-Barr virus latent genes in vivo is dependent upon the differentiation stage of the infected B cell. Immunity 13:497-506. - PubMed
    1. Bodescot, M., M. Perricaudet, and P. J. Farrell. 1987. A promoter for the highly spliced EBNA family of RNAs of Epstein-Barr virus. J. Virol. 61:3424-3430. - PMC - PubMed

Publication types

LinkOut - more resources