. 2006 Jun 12;203(6):1459-70.
doi: 10.1084/jem.20052187. Epub 2006 May 22.

Autoimmune arthritis associated with mutated interleukin (IL)-6 receptor gp130 is driven by STAT3/IL-7-dependent homeostatic proliferation of CD4+ T cells

Affiliations

Autoimmune arthritis associated with mutated interleukin (IL)-6 receptor gp130 is driven by STAT3/IL-7-dependent homeostatic proliferation of CD4+ T cells

Shin-ichiro Sawa et al. J Exp Med. .

Abstract

Mice homozygous for the F759 mutation in the gp130 interleukin (IL)-6 receptor subunit have enhanced gp130-mediated signal transducer and activator of transcription (STAT)3 activation and spontaneously developed a lymphocyte-mediated rheumatoid arthritis-like joint disease. Here, we show that the development of the disease is dependent on both major histocompatibility complex (MHC) II-restricted CD4+ T cells and IL-6 family cytokines. In spite of the necessity for CD4+ T cells, the gp130 mutation was only required in nonhemtopoietic cells for the disease. The gp130 mutation resulted in enhanced production of IL-7. Conditional knockout of STAT3 in nonlymphoid cells showed that the enhancement of IL-7 production was dependent on STAT3 activation by IL-6 family cytokines. Homeostatic proliferation of CD4+ T cells was enhanced in gp130 mutant mice and acceleration of homeostatic proliferation enhanced the disease, whereas the inhibition of homeostatic proliferation suppressed the disease. Anti-IL-7 antibody treatment inhibited not only the enhanced homeostatic proliferation, but also the disease in gp130 mutant mice. Thus, our results show that autoimmune disease in gp130 mutant mice is caused by increased homeostatic proliferation of CD4+ T cells, which is due to elevated production of IL-7 by nonhematopoietic cells as a result of IL-6 family cytokine-gp130-STAT3 signaling.


Figures
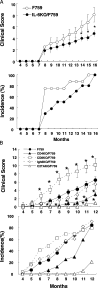
Figure 1.
Figure 1.
The arthritis of F759 is dependent on IL-6 and MHCII-restricted CD4+ T cells. (A) Clinical score and incidence of arthritis in IL-6KO/F759 (closed circles, n = 10) and IL-6KO hetero/F759 or F759 (open circles, n = 10). (top) Data are the mean ± SEM of the arthritis scores. (bottom) Incidence of arthritis with a score >4.0. The p-value was calculated by Student's t test. Clinical scores of 14–16-mo-old IL-6KO/F759 were significantly lower than the control. (*, P < 0.05) (B) Clinical scores and incidences of arthritis in Igh6KO/F759 (open diamonds, n = 25), CD8KO/F759 (open squares, n = 30), CD4KO/F759 (closed triangles, n = 21), C2TAKO/F759 (open triangles, n = 19), and F759 (closed circles, n = 80). (top) Data are the mean ± SEM of the arthritis scores. (bottom) Incidence of arthritis with a score >2.0. Clinical scores of 6-12-mo-old CD8KO/F759 were significantly higher (*, P < 0.05). Scores of 5–12-mo-old CD4KO/F759 and C2TAKO/F759 were significantly lower. (*, P < 0.05).
Figure 2.
Figure 2.
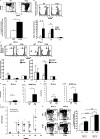
Increase in CD44highCD4+ T cells, lymphadenopathy, splenomegaly, and enhanced homeostatic proliferation in the periphery of F759. (A) FACS profiles of CD4+ T cells isolated from sLNs of F759 and control mice (8–10 mo old). These experiments were performed three times independently; representative data are shown. The percentage of CD44highCD4+ T cells (CD62Lhigh and CD62Llow) is shown with error bars indicating 1 SD. The p-value was calculated by Student's t test (*, P = 0.0000025). (B) CD44lowCD4+ T cells were sorted from C57BL/6/SJL mice, labeled with CFSE, and injected into irradiated wild type or C57BL/6/F759. FACS profiles of the CD45.1+CD4+T cells in the sLNs and spleen are shown. These experiments were performed five times independently and representative data are shown. The relative amount of CFSEhigh (most slowly dividing [A]), CFSEmiddle [B], and CFSElow (most rapidly dividing [C]) cells, with the value for CFSEhigh defined as 1, is shown with error bars indicating 1 SD. The p-value was calculated by Student's t test (*, P = 0.00037 and **, P = 0.000002). (C) CD44lowCD4+ T cells from C57BL/6/SJL were CFSE labeled and injected into nonthymectomized and N7Txed C57BL/6 or C57BL/6/F759 neonates. FACS profiles of CD45.1+CD4+ T cells from the sLNs and spleen are shown. These experiments were performed three times independently and representative data are shown. The relative amount of CFSEhigh (A), CFSEmiddle (B), and CFSElow (C) cells, with the value for CFSEhigh defined as 1, is shown with error bars indicating 1 SD. The p-value was calculated by Student's t test (*, P = 0.0017 and **, P = 0.0008). (D and E) The sLNs (D) and spleen (E) were from and the total cell numbers were calculated. The mean is shown with error bars indicating 1 SD. The p-value was calculated by Student's t test (*, P = 0.0042; **, P = 0.0038; ***, P = 0.00034; and ****, P = 0.00027). (F) The sLNs and spleen were harvested from NT7xed C57BL/6 and C56BL/6/F759. The numbers of CD4+ T cells were calculated from FACS analyses (open circles; N7Txed F759 and open triangles; N7Txed wild type). The mean is shown as open (N7Txed wild type) and closed (N7Txed F759) bars. The p-value was calculated by Student's t test (*, P = 0.0065; **, P = 0.0068; ***, P = 0.00034; and ****, P = 0.00021). (G) Neonatal thymectomy increased the CD44high memory/activated CD4+ T cells in the spleen of NTx F759. FACS profiles of CD4+ T cells isolated from the spleen of N7Txed or sham-N7Txed F759 and wild-type mice (2 wk old). These experiments were performed twice independently (total 12 samples each) and representative data are shown. The percentage of CD44highCD4+ T cells (CD62Lhigh and CD62Llow) is shown with error bars indicating 1 SD. The p-value was calculated by Student's t test (*, P = 0.024; **, P = 0.0032; ***, P = 0.00000039; and ****, P = 0.0000002).
Figure 3.
Figure 3.
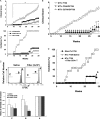
CD4+ T cell homeostatic proliferation played a critical role for the disease development in F759. (A) Clinical score and incidence of arthritis in N7Txed F759 (open circles, n = 30), F759 hetero or N7Txed wild-type (open triangles, n = 24), and sham-Txed F759 (closed circles, n = 20). (top) Data are the means ± SEM of the arthritis scores. (bottom) Incidence of arthritis with a score >2.0. Clinical scores of 10–30-wk-old N7TxF759 were significantly higher than the sham N7Tx ones (*, P < 0.05). (B) Data are the means ± SEM of the arthritis score in N7Txed F759 (open circles, n = 12), N7Txed CD4KO/F759 (closed triangles, n = 12), and N7Txed C2TAKO/F759 (open triangles, n = 12). Clinical scores of N7Txed CD4KO/F759 and N7Txed C2TAKO/F759 (13–30 wk old) were significantly milder than N7Txed F759 ones (*, P < 0.05). (C) CD44lowCD4+ T cells from C57BL/6/SJL were labeled with CFSE and injected i.v. with or without filler T cells injected i.p. into N7Txed C57BL/6/F759 neonates. FACS profiles of CD45.1+CD4+ T cells from sLNs and spleen are shown. These experiments were performed three times independently and representative data are shown. The relative amount of CFSEhigh (A), CFSEmiddle (B), and CFSElow (C) cells, with the value for CFSEhigh defined as 1, is shown with error bars indicating 1 SD. (D) Incidence of arthritis with a score >2.0 in N7Txed F759 plus saline (open circles, n = 14), N7Txed F759 plus i.p. injection of filler T cells (closed triangles, n = 14) and sham-N7Txed F759 (closed circles, n = 15).
Figure 4.
Figure 4.
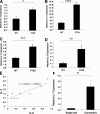
Increased IL-7 expression in nonhematopoietic cells in F759. (A) The sLNs were harvested from wild-type C57BL/6 and C57BL/6/F759. Real-time PCR for IL-7 was performed. (B) The sLNs were harvested from wild-type C57BL/6 and C57BL/6/F759 10 d after irradiation. Real-time PCR was performed for IL-7. (C and D) The sLNs were harvested from N7Txed wild-type C57BL/6 and C57BL/6/F759 10 d after N7Tx. Real-time PCR was performed for IL-7 (C) and IL-6 (D). The mean is shown with error bars indicating 1 SD. The p-value was calculated by Student's t test (*, P = 0.0021; **, P = 0.011; ***, P = 0.00041; and ****, P = 0.000000003). These experiments were performed three times independently and representative data are shown. (E) The correlation between relative IL-7 and IL-6 expression in N7Txed wild-type or F759 is shown. The correlation efficiency was 0.88. (F) The sLNs were harvested from C57BL/6/F759. The cell strainer pass-through and the retained fractions were prepared. Real-time PCR was performed for IL-7. The mean is shown with error bars indicating 1 SD. The p-value was calculated by Student's t test (*, P = 0.0021). These experiments were performed three times independently and representative data are shown.
Figure 5.
Figure 5.
IL-6 injection induced IL-7 in vivo and gp130-STAT3 directly induced IL-7 in the fibroblasts of F759. (A) IL-6KO/F759 (nonirradiated) with i.v. injection IL-6 was prepared. Real-time PCR for IL-7 or SOCS3 was performed using RNA from the sLNs of the IL-6KO/F759. These experiments were performed two times independently and the sum of the data is shown. (B) IL-6 KO mice with irradiation 24 h before the i.v. injection of IL-6 was prepared. Real-time PCR for IL-7 was performed using RNA from the sLNs. These experiments were performed three times independently and representative data are shown. The p-value was calculated by Student's t test (in A: *, P = 0.034; **, P = 0.018). In B, *, P = 0.016. (C) Splenic fibroblasts were prepared and stimulated with IL-6. Real-time PCR was performed for IL-7 and SOCS3. The mean is shown with error bars indicating 1 SD. Student's t test was done between IL-6–treated and untreated cells. The p-value was calculated by Student's t test (*, P < 0.05 and **, P < 0.01). These experiments were performed three times independently and representative data are shown. (D) Splenic fibroblasts prepared from wild-type neonates were stimulated with IL-6 plus sIL-6R. Real-time PCR was performed for IL-7 and SOCS3. The mean is shown with error bars indicating 1 SD. The p-value was calculated by Student's t test (*, P = 0.010 and **, P = 0.014). These experiments were performed three times independently and representative data are shown. (E) Splenic fibroblasts from F759 were stimulated with IL-6 plus sIL-6R, OSM, and LIF. Real-time PCR was performed for IL-7 and SOCS3. The mean is shown with error bars indicating 1 SD. The p-value was calculated by Student's t test (*, P < 0.05 and **, P < 0.01). These experiments were performed three times independently and representative data are shown. (F, top left) MEF were prepared from FxxQ or wild-type fetus were stimulated with IL-6 plus sIL-6R. Real-time PCR was performed for IL-7. The mean is shown with error bars indicating 1 SD. The p-value was calculated by Student's t test (**, P < 0.01). These experiments were performed three times independently and representative data are shown. (top right) Col1a-STAT3, control (STAT3flox/flox or type I-collagen-Cre/STAT3flox/+), and F759 were irradiated, and the sLNs were harvested and cultured with IL-6 plus sIL-6R. Real-time PCR for IL-7 was performed using sLNs. The mean is shown with error bars indicating 1 SD. The p-value was calculated by Student's t test (*, P < 0.05). These experiments were performed three times independently and representative data are shown. (bottom) Col1a-STAT3, control, and F759 were irradiated. Real-time PCR for IL-7 or SOCS3 was performed using the lymph nodes. The mean is shown with error bars indicating 1 SD. The p-value was calculated by Student's t test (*, P < 0.05; **, P < 0.01). These experiments were performed three times independently and representative data are shown. (G) MEF were prepared from F759 or wild-type fetus were stimulated with IL-6 plus sIL-6R. Their protein fractions were prepared and applied on SDS-page followed by Western blotting of IL-7. (H) The sLNs irradiated Col1a-STAT3, wild-type, and F759 were harvested. Their protein fractions were prepared and applied on SDS-page followed by Western blotting of IL-7.
Figure 6.
Figure 6.
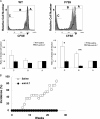
IL-7 expression was involved in the enhanced CD4+ T cell HP and was necessary for development of the disease in F759 neonates. (A) CD44lowCD4+ T cells were sorted from C57BL/6/SJL mice, labeled with CFSE, and injected into N7Txed C57BL/6 or C57BL/6/F759 neonates 8 d after birth. Anti–IL-7 antibody (dotted lines) or control IgG2b antibody (shaded profiles, 0.1 mg/each) was i.p. injected. The sLNs and spleen were harvested 14 d after T cell injection and FACS profiles of CD45.1+CD4+ T cells are shown. These experiments were performed three times independently and representative data are shown. The relative amount of CFSEhigh (A), CFSEmiddle (B), and CFSElow (C) cells, with the value for CFSEhigh defined as 1, is shown with error bars indicating 1 SD. The p-value was calculated by Student's t test (*; P = 0.012; **, P = 0.00023). (B) Incidence of arthritis with a score >2.0 in N7Txed F759 plus saline (open circles) or N7Txed F759 plus anti–IL-7 antibody (closed circles).

Similar articles

Cited by

References

    1. Firestein, G.S. 2003. Evolving concepts of rheumatoid arthritis. Nature. 423:356–361. - PubMed
    1. Marrack, P., J. Kappler, and B. Kotzin. 2001. Autoimmune disease: why and where it occurs. Nat. Med. 7:899–905. - PubMed
    1. Hirano, T. 2002. Cytokines in autoimmune disease and chronic inflammatory proliferative disease. Cytokine Growth Factor Rev. 13:297–298. - PubMed
    1. Kontoyiannis, D., M. Pasparakis, T. Pizarro, F. Cominelli, and G. Kollias. 1999. Impaired on/off regulation of TNF biosynthesis in mice lacking TNF AU-rich elements: implications for joint and gut-associated immunopathologies. Immunity. 10:387–398. - PubMed
    1. Kollias, G., E. Douni, G. Kassiotis, and D. Kontoyiannis. 1999. The function of tumour necrosis factor and receptors in models of multi-organ inflammation, rheumatoid arthritis, multiple sclerosis and inflammatory bowel disease. Ann. Rheum. Dis. 58:I32–I39. - PMC - PubMed

Publication types