The leukocyte receptor complex in chicken is characterized by massive expansion and diversification of immunoglobulin-like Loci
- PMID: 16699593
- PMCID: PMC1458963
- DOI: 10.1371/journal.pgen.0020073
The leukocyte receptor complex in chicken is characterized by massive expansion and diversification of immunoglobulin-like Loci
Abstract
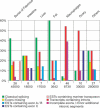
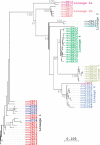
The innate and adaptive immune systems of vertebrates possess complementary, but intertwined functions within immune responses. Receptors of the mammalian innate immune system play an essential role in the detection of infected or transformed cells and are vital for the initiation and regulation of a full adaptive immune response. The genes for several of these receptors are clustered within the leukocyte receptor complex (LRC). The purpose of this study was to carry out a detailed analysis of the chicken (Gallus gallus domesticus) LRC. Bacterial artificial chromosomes containing genes related to mammalian leukocyte immunoglobulin-like receptors were identified in a chicken genomic library and shown to map to a single microchromosome. Sequencing revealed 103 chicken immunoglobulin-like receptor (CHIR) loci (22 inhibitory, 25 activating, 15 bifunctional, and 41 pseudogenes). A very complex splicing pattern was found using transcript analyses and seven hypervariable regions were detected in the external CHIR domains. Phylogenetic and genomic analysis showed that CHIR genes evolved mainly by block duplications from an ancestral inhibitory receptor locus, with transformation into activating receptors occurring more than once. Evolutionary selection pressure has led not only to an exceptional expansion of the CHIR cluster but also to a dramatic diversification of CHIR loci and haplotypes. This indicates that CHIRs have the potential to complement the adaptive immune system in fighting pathogens.
Conflict of interest statement
Competing interests. The authors have declared that no competing interests exist.
Figures


Similar articles
-
The red jungle fowl leukocyte receptor complex contains a large, highly diverse number of chicken immunoglobulin-like receptor (CHIR) genes.Mol Immunol. 2010 Jul;47(11-12):1956-62. doi: 10.1016/j.molimm.2010.05.001. Epub 2010 May 26. Mol Immunol. 2010. PMID: 20510455
-
Bi-Functional Chicken Immunoglobulin-Like Receptors With a Single Extracellular Domain (ChIR-AB1): Potential Framework Genes Among a Relatively Stable Number of Genes Per Haplotype.Front Immunol. 2019 Sep 18;10:2222. doi: 10.3389/fimmu.2019.02222. eCollection 2019. Front Immunol. 2019. PMID: 31620133 Free PMC article.
-
Origin and evolution of the chicken leukocyte receptor complex.Proc Natl Acad Sci U S A. 2005 Mar 15;102(11):4057-62. doi: 10.1073/pnas.0501040102. Epub 2005 Mar 7. Proc Natl Acad Sci U S A. 2005. PMID: 15753291 Free PMC article.
-
The chicken leukocyte receptor cluster.Vet Immunol Immunopathol. 2011 Nov 15;144(1-2):1-10. doi: 10.1016/j.vetimm.2011.07.001. Epub 2011 Jul 7. Vet Immunol Immunopathol. 2011. PMID: 21794927 Review.
-
The genomic context of natural killer receptor extended gene families.Immunol Rev. 2001 Jun;181:20-38. doi: 10.1034/j.1600-065x.2001.1810102.x. Immunol Rev. 2001. PMID: 11513141 Review.
Cited by
-
The immune gene repertoire of an important viral reservoir, the Australian black flying fox.BMC Genomics. 2012 Jun 20;13:261. doi: 10.1186/1471-2164-13-261. BMC Genomics. 2012. PMID: 22716473 Free PMC article.
-
Channel catfish leukocyte immune-type receptors contain a putative MHC class I binding site.Immunogenetics. 2007 Jan;59(1):77-91. doi: 10.1007/s00251-006-0169-3. Epub 2006 Dec 6. Immunogenetics. 2007. PMID: 17149620
-
The phylogenetic origins of natural killer receptors and recognition: relationships, possibilities, and realities.Immunogenetics. 2011 Mar;63(3):123-41. doi: 10.1007/s00251-010-0506-4. Epub 2010 Dec 30. Immunogenetics. 2011. PMID: 21191578 Free PMC article. Review.
-
The Turkey Ig-like receptor family: identification, expression and function.PLoS One. 2013;8(3):e59577. doi: 10.1371/journal.pone.0059577. Epub 2013 Mar 18. PLoS One. 2013. PMID: 23527222 Free PMC article.
-
Identification of the ancestral killer immunoglobulin-like receptor gene in primates.BMC Genomics. 2006 Aug 15;7:209. doi: 10.1186/1471-2164-7-209. BMC Genomics. 2006. PMID: 16911775 Free PMC article.
References
-
- Brown D, Trowsdale J, Allen R. The LILR family: Modulators of innate and adaptive immune pathways in health and disease. Tissue Antigens. 2004;64:215–225. - PubMed
-
- Vilches C, Parham P. KIR: Diverse, rapidly evolving receptors of innate and adaptive immunity. Annu Rev Immunol. 2002;20:217–251. - PubMed
-
- Hoelsbrekken SE, Fossum S, Dissen E. Molecular cloning of LILRC1 and LILRC2 in the mouse and the rat, two novel immunoglobulin-like receptors encoded by the leukocyte receptor gene complex. Immunogenetics. 2005;57:479–486. - PubMed
-
- Wende H, Volz A, Ziegler A. Extensive gene duplications and a large inversion characterize the human leukocyte receptor cluster. Immunogenetics. 2000;51:703–713. - PubMed
Publication types
MeSH terms
Substances
Grants and funding
LinkOut - more resources
Full Text Sources
Other Literature Sources

