

doi: 10.1186/gb-2006-7-5-r37.
Epub 2006 May 5.
Inferring transcriptional modules from ChIP-chip, motif and microarray data
Affiliations
- PMID: 16677396
- PMCID: PMC1779513
- DOI: 10.1186/gb-2006-7-5-r37
Item in Clipboard
Inferring transcriptional modules from ChIP-chip, motif and microarray data
Genome Biol.
2006.
Abstract
'ReMoDiscovery' is an intuitive algorithm to correlate regulatory programs with regulators and corresponding motifs to a set of co-expressed genes. It exploits in a concurrent way three independent data sources: ChIP-chip data, motif information and gene expression profiles. When compared to published module discovery algorithms, ReMoDiscovery is fast and easily tunable. We evaluated our method on yeast data, where it was shown to generate biologically meaningful findings and allowed the prediction of potential novel roles of transcriptional regulators.
Figures
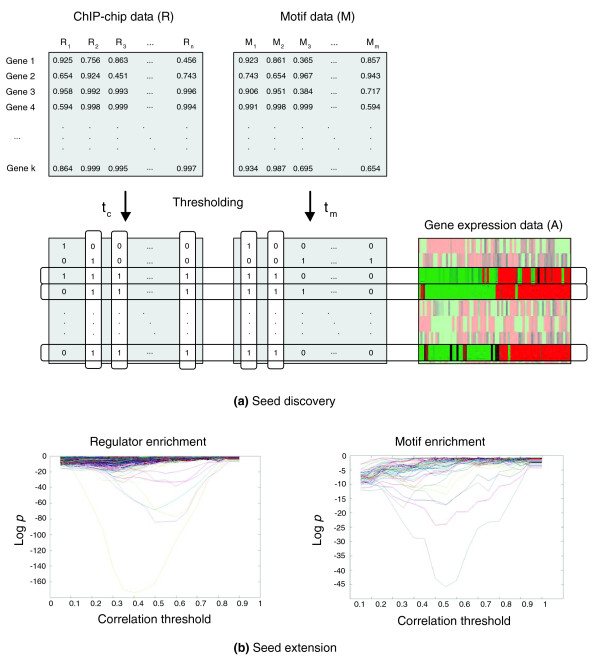
ReMoDiscovery analysis flow. ReMoDiscovery consists of a seed discovery step followed by a seed extension step. ChIP-chip data, motif data, and expression data are used as input for the algorithm. These three datasets can be represented as matrices in which the rows represent the genes. For the ChIP-chip data (R) the columns represent the regulators, for the motif data (M) they represent the motifs and for the expression data (A) the different experiments. (a) The seed discovery step identifies sets of genes that are co-expressed, bind the same regulators, and have the same motifs in their intergenic region. (b) The gene content of the seed modules can be extended during the seed extension step using less stringent criteria. The logarithms of the module enrichment p values (y-axis) are plotted for all regulators (motifs) as a function of the correlation threshold (x-axis). Each line in the sample plot shows the module enrichment p values for the enrichment of its corresponding regulator (motif) as a function of the gene expression correlation threshold used.
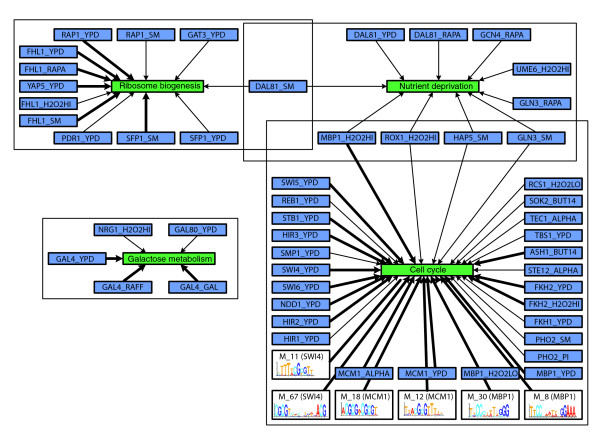
Overview of the seed modules identified in the Spellman dataset [12]. For visualization purposes, seed modules with similar function are combined (indicated in green). A regulator or motif that is part of a regulatory program of an extended module is indicated in the figure by a bold edge from the regulator or motif to its module.
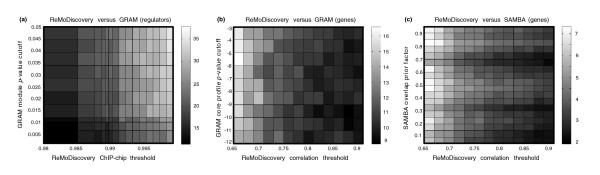
Representative examples from the module content similarity analysis. The significance of the similarity in module content between ReMoDiscovery seed modules and GRAM [9] and SAMBA [3] output is shown at different parameter settings. The color bar on the right indicates the normalized Jaccard similarity score, that is, the number of standard deviations from the mean of the distribution of Jaccard similarity scores on randomized module partitioning. (a) Regulator content similarity between ReMoDiscovery and GRAM, with varying GRAM module p value cutoff and ReMoDiscovery Chip-chip threshold. (b) Gene content similarity between ReMoDiscovery and GRAM, with varying GRAM core profile p value cutoff and ReMoDiscovery correlation threshold. (c) Gene content similarity between ReMoDiscovery and SAMBA, with varying SAMBA overlap prior factor and ReMoDiscovery correlation threshold.
Similar articles
-
Discovering transcriptional modules from motif, chip-chip and microarray data.Pac Symp Biocomput. 2005:483-94. Pac Symp Biocomput. 2005. PMID: 15759653
-
Combining sequence and time series expression data to learn transcriptional modules.IEEE/ACM Trans Comput Biol Bioinform. 2005 Jul-Sep;2(3):194-202. doi: 10.1109/TCBB.2005.34. IEEE/ACM Trans Comput Biol Bioinform. 2005. PMID: 17044183
-
CAGER: classification analysis of gene expression regulation using multiple information sources.BMC Bioinformatics. 2005 May 12;6:114. doi: 10.1186/1471-2105-6-114. BMC Bioinformatics. 2005. PMID: 15890068 Free PMC article.
-
An algorithmic perspective of de novo cis-regulatory motif finding based on ChIP-seq data.Brief Bioinform. 2018 Sep 28;19(5):1069-1081. doi: 10.1093/bib/bbx026. Brief Bioinform. 2018. PMID: 28334268 Review.
-
Transcriptional regulatory networks and the yeast cell cycle.Curr Opin Cell Biol. 2002 Dec;14(6):676-83. doi: 10.1016/s0955-0674(02)00391-5. Curr Opin Cell Biol. 2002. PMID: 12473339 Review.
Cited by
-
Inferring Transcriptional Interactions by the Optimal Integration of ChIP-chip and Knock-out Data.Bioinform Biol Insights. 2009 Oct 21;3:129-40. doi: 10.4137/bbi.s3445. Bioinform Biol Insights. 2009. PMID: 20140075 Free PMC article.
-
Inference of hierarchical regulatory network of estrogen-dependent breast cancer through ChIP-based data.BMC Syst Biol. 2010 Dec 17;4:170. doi: 10.1186/1752-0509-4-170. BMC Syst Biol. 2010. PMID: 21167036 Free PMC article.
-
Gene regulatory pattern analysis reveals essential role of core transcriptional factors' activation in triple-negative breast cancer.Oncotarget. 2017 Mar 28;8(13):21938-21953. doi: 10.18632/oncotarget.15749. Oncotarget. 2017. PMID: 28423538 Free PMC article.
-
DISTILLER: a data integration framework to reveal condition dependency of complex regulons in Escherichia coli.Genome Biol. 2009;10(3):R27. doi: 10.1186/gb-2009-10-3-r27. Epub 2009 Mar 6. Genome Biol. 2009. PMID: 19265557 Free PMC article.
-
PyPanda: a Python package for gene regulatory network reconstruction.Bioinformatics. 2016 Nov 1;32(21):3363-3365. doi: 10.1093/bioinformatics/btw422. Epub 2016 Jul 10. Bioinformatics. 2016. PMID: 27402905 Free PMC article.
References
-
- Segal E, Shapira M, Regev A, Pe'er D, Botstein D, Koller D, Friedman N. Module networks: identifying regulatory modules and their condition-specific regulators from gene expression data. Nat Genet. 2003;34:166–176. - PubMed
-
- Van den Bulcke T, Lemmens K, Van de Peer Y, Marchal K. Inferring transcriptional networks by mining 'omics' data. Current Bioinformatics.
Publication types
MeSH terms
Substances
LinkOut - more resources
Full Text Sources
Molecular Biology Databases
