. 2006 May 8;173(3):383-94.
doi: 10.1083/jcb.200511093. Epub 2006 May 1.

Stress fibers are generated by two distinct actin assembly mechanisms in motile cells

Affiliations

Stress fibers are generated by two distinct actin assembly mechanisms in motile cells

Pirta Hotulainen et al. J Cell Biol. .

Abstract

Stress fibers play a central role in adhesion, motility, and morphogenesis of eukaryotic cells, but the mechanism of how these and other contractile actomyosin structures are generated is not known. By analyzing stress fiber assembly pathways using live cell microscopy, we revealed that these structures are generated by two distinct mechanisms. Dorsal stress fibers, which are connected to the substrate via a focal adhesion at one end, are assembled through formin (mDia1/DRF1)-driven actin polymerization at focal adhesions. In contrast, transverse arcs, which are not directly anchored to substrate, are generated by endwise annealing of myosin bundles and Arp2/3-nucleated actin bundles at the lamella. Remarkably, dorsal stress fibers and transverse arcs can be converted to ventral stress fibers anchored to focal adhesions at both ends. Fluorescence recovery after photobleaching analysis revealed that actin filament cross-linking in stress fibers is highly dynamic, suggesting that the rapid association-dissociation kinetics of cross-linkers may be essential for the formation and contractility of stress fibers. Based on these data, we propose a general model for assembly and maintenance of contractile actin structures in cells.


Figures
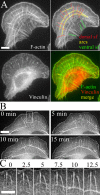
Figure 1.
Figure 1.
Contractile actin arrays in U2OS cells. (A) Focal adhesions and F-actin were visualized with anti-vinculin antibodies and phalloidin, respectively. Three categories of contractile actin arrays are highlighted on the F-actin image (top right): dorsal stress fibers (red), transverse arcs (yellow), and ventral stress fibers (green). Bar, 10 μm. (B) Actin dynamics in U2OS cells visualized by GFP-actin. Time-lapse images were taken from Video 1 (available at http://www.jcb.org/cgi/conent/full/jcb.200511093/DC1). Bar, 10 μm. Time-lapse frames of region of interest (indicated with a white rectangle) are displayed in C in higher magnification. (C) Dorsal stress fibers interact with sides of arcs to form a continuous stress fiber network. Time is shown in minutes. Bar, 5 μm.
Figure 2.
Figure 2.
Ventral stress fiber assembly. Time-lapse images of U2OS cell expressing YFP-actin (green) and zyxin-CFP (red). The same time-lapse images in grayscale are shown in the bottom panel to highlight the assembly of a single ventral stress fiber. Dorsal stress fibers, transverse arc, and ventral stress fiber are indicated with red, yellow, and green, respectively. The focal adhesions are marked with arrows in both panels. The two arrows at the upper part of the cell (9–18-min frames) indicate two focal adhesions, which both appear to anchor the stress fiber to substrate. The more distal focal adhesion disappears during the maturation of the stress fiber. See Video 3 (available at http://www.jcb.org/cgi/content/full/jcb.200511093/DC1). Bar, 10 μm.
Figure 3.
Figure 3.
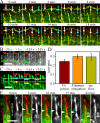
Mechanism of dorsal stress fiber assembly. (A) Time-lapse images of a U2OS cell expressing zyxin-CFP (red) and α-actinin–YFP (green). White arrows indicate elongating dorsal stress fibers, which eventually bind to the sides of the transverse arc. Cyan arrows indicate a growing stress fiber, which binds to another focal adhesion from its proximal end. See Video 4 (available at http://www.jcb.org/cgi/content/full/jcb.200511093/DC1). (B) The elongation rate of entire dorsal stress fibers was measured from time-lapse images of GFP-actin–expressing U2OS cells. Red and green arrows indicate the positions of distal and proximal ends of the actin bundle, respectively. (C) GFP-actin in a dorsal stress fiber was photobleached from a 2.5-μm-wide region (outlined with white lines) close to the focal adhesion, and elongation of the bright region of the dorsal stress fiber was subsequently measured from time-lapse images acquired after photobleaching. (D) Comparison of elongation rate of entire dorsal stress fibers (filament elongation; mean of 18 stress fibers), growth rate close to focal adhesions (FA polym) as measured by photobleaching experiments (mean of 10 stress fibers), and the rate of centripetal flow of transverse arcs (arc flow; mean of 8 arcs). SEMs are indicated in the graph. (E) Analysis of myosin incorporation into dorsal stress fibers in U2OS cells expressing α-actinin–CFP (red in color images and white in black-and-white images) and YFP-MLC (green). Arrowheads indicate the point of myosin incorporation detected by an appearance of MLC fluorescence and subsequent displacement of α-actinin (black-and-white images). Incorporated myosin bundle moves toward the cell center because of elongation of the dorsal stress fiber. After 43 min, the proximal end of the dorsal stress fiber is decorated by several myosin II dots (indicated by white arrows). In all time-lapse frames, the leading edge of cell is at the top and the cell center is toward the bottom of the panel. Bars, 5 μm.
Figure 4.
Figure 4.
mDia1/DRF1 depletion affects elongation rate and morphology of dorsal stress fibers. (A) Western blot analysis demonstrating the mDia1/DRF1 protein levels in wild-type (wt) and mDia1/DRF1 siRNA–transfected (-Dia) U2OS cells. Equal amounts of cell lysates (10 μg) were run on polyacrylamide gel, and mDia1/DRF1 (α-Dia) and actin (α-actin) were visualized by Western blotting. (B) mDia1/DRF1 levels are decreased in mDia1/DRF1 siRNA–transfected cells. U2OS cells were transfected with Alexa 488–labeled mDia1/DRF1 (Dia) siRNA oligonucleotides and replated as a mixture with wild-type cells. mDia1/DRF1 is visualized with anti-mDia1/DRF1 (α-Dia) antibody staining (top). Cells containing Alexa 488–mDia1/DRF1 siRNA oligos (bottom, cell highlighted with a white line) have clearly reduced expression levels of mDia1/DRF1 (top). (C) Comparison of dorsal stress fiber elongation rates in wild-type cells (mean of 18 stress fibers) and in mDia1/DRF1 siRNA–transfected cells (mean of 22 stress fibers). Also, the rate of centripetal flow of transverse arcs (arc flow) was determined from both cell populations (wild type, mean of 8 arcs; -Dia, mean of 9 arcs). SEMs and statistical significance, calculated by Mann-Whitney U test, are indicated in the graph. (D) Live cell analysis of wild-type (top) and mDia1/DRF1 knockdown cells (Dia-siRNA, two examples). Cells were transfected with α-actinin–YFP (green) and with zyxin-CFP (red; at the bottom panel, only α-actinin is shown). In wild-type cells, α-actinin was aligned regularly throughout the dorsal stress fibers, whereas in mDia1/DRF1 knockdown cells irregular accumulation of α-actinin into dorsal stress fibers was detected. See Videos 5–7 (available at http://www.jcb.org/cgi/content/full/jcb.200511093/DC1). Bars, 10 μm.
Figure 5.
Figure 5.
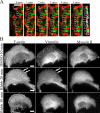
Mechanism of transverse arc assembly. (A) A U2OS cell expressing α-actinin–CFP (red) and YFP-MLC (green) was monitored by time-lapse imaging. Individual α-actinin (a) and myosin (m) bands are indicated by numbers (see diagram on the right). Cell edge is located on the left side and the center of the cell on the right side. Transverse arcs are generated by endwise annealing of short α-actinin cross-linked actin and myosin bundles. Bar, 5 μm. (B) U2OS cells were treated with 90% DMSO (control) for 30 min (top) or with 50 μM blebbistatin for 20 min (middle) or 30 min (bottom). Cells were fixed, and F-actin, vinculin (focal adhesions), and myosin II were visualized by phalloidin and anti-vinculin and anti–myosin II antibodies, respectively. White arrows indicate remaining focal adhesions and dorsal stress fibers in blebbistatin-treated cells, whereas transverse arcs were no longer detected in these cells after 20 min of blebbistatin treatment. Bars, 10 μm.
Figure 6.
Figure 6.
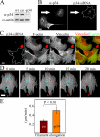
p34 depletion results in a loss of lamellipodia and transverse arcs. (A) Western blot analysis demonstrating the p34 protein levels in wild-type (wt) cells, in control cells treated with transfection reagents (co), and in p34 siRNA–transfected (-p34) U2OS cells. Equal amounts of cell lysates (15 μg) were run on polyacrylamide gel, and p34 (α-p34) and actin (α-actin) were visualized by Western blotting. (B) U2OS cells were transfected with Alexa 488–labeled p34 siRNA oligonucleotides and replated as a mixture with wild-type cells. p34 was visualized with anti-p34 antibody (left, α-p34). The cell containing Alexa 488–p34 siRNA oligonucleotides (right, arrow) displays reduced p34 levels (left, arrow). (C) Cells containing Alexa 488–p34 siRNA oligonucleotides (left, arrow) displayed a loss of lamellipodal actin network and transverse arcs. F-actin was visualized by phalloidin (F-actin), and focal adhesions were labeled with anti-vinculin antibody (vinculin). (D) Live cell analysis of p34 knockdown cell expressing GFP-actin. Only the lamella of a polarized cell is shown. Dorsal stress fibers elongate from sides of lamella toward the center of lamella. The ends of two dorsal stress fibers growing from the opposite sides of the lamella are highlighted with red and cyan arrowheads. Endwise annealing of the two dorsal stress fibers leads to a formation a stress fiber attached to substrate from both ends. See Video 9 (available at http://www.jcb.org/cgi/content/full/jcb.200511093/DC1). (E) Comparison of dorsal stress fiber elongation rates in control cells treated with transfection reagents (mean of 25 stress fibers) and in p34 siRNA–transfected cells (mean of 13 stress fibers). Statistical significance, calculated by Mann-Whitney U test, and SEMs are indicated in the graph. Bars, 10 μm.
Figure 7.
Figure 7.
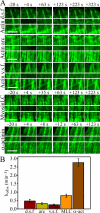
Dynamics of stress fiber components. Association/dissociation rates of GFP-actin were analyzed by FRAP from different types of contractile actin arrays. In addition, association/dissociation rates of MLC (GFP-MLC) and α-actinin (α-actinin–GFP) were analyzed from ventral stress fibers. (A) Time-lapse images before photobleaching (−20 s) and immediately after (+4 s) are shown together with selected time-lapse frames that demonstrate the rate of fluorescence recovery. The fourth frame (surrounded by wider white lines) represents the time point when approximately half of the fluorescence was recovered. (B) The rates of fluorescence recovery of individual filament bundles were analyzed by Leica software, half-recovery time was quantified from 8–9 recovery curves for each category, and kobs values were calculated. SEMs are indicated in the graph. d.s.f., dorsal stress fibers; v.s.f., ventral stress fibers Bars, 5 μm.
Figure 8.
Figure 8.
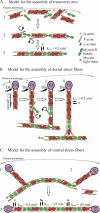
Model for the assembly of transverse arcs, dorsal stress fibers, and ventral stress fibers. (A) Transverse arc. (1) Short actin bundles cross-linked by α-actinin are generated at the plasma membrane through nucleation by the Arp2/3 complex. (2) Actin bundles associate endwise with myosin II bundles close to the plasma membrane. (3) During centripetal flow, the α-actinin and myosin II bands are equalized in width, the entire bundle is straightened, and the width of bands is decreased, apparently as the result of a contraction of the transverse arc. (B) Dorsal stress fiber. (1) After formation of a focal adhesion (FA), short unipolar actin filaments are polymerized by mDia1/DRF1-dependent mechanism (Dia) from the focal adhesion at the rate of 0.3 μm/min. Polymerized actin filaments are simultaneously cross-linked by α-actinin. (2–4) The proximal end of a dorsal stress fiber is connected to the side of a transverse arc. When dorsal stress fiber has reached the length of several micrometers, myosin II can be occasionally incorporated into α-actinin cross-linked bundle, leading to a simultaneous displacement of α-actinin. (C) Ventral stress fiber. (1) Preassembled dorsal stress fibers and arcs interact with each other. (2) The transverse arc region that is not located between the two dorsal stress fibers is disconnected from the structure. (3) The transverse arc aligns between the two dorsal stress fibers, contracts, and subsequently forms a ventral stress fiber that is anchored to focal adhesions at both ends. The dynamics of actin, α-actinin, and MLC association to stress fibers are indicated in the figure. Note that α-actinin associates with stress fibers in a highly dynamic manner. This dynamic filament cross-linking may be essential for myosin incorporation into dorsal stress fibers as well as for contractility of mature stress fibers.

Similar articles

Cited by

References

    1. Bear, J.E., T.M. Svitkina, M. Krause, D.A. Schafer, J.J. Loureiro, G.A. Strasser, I.V. Maly, O.Y. Chaga, J.A. Cooper, G.G. Borisy, and F.B. Gertler. 2002. Antagonism between Ena/VASP proteins and actin filament capping regulates fibroblast motility. Cell. 109:509–521. - PubMed
    1. Bertling, E., P. Hotulainen, P.K. Mattila, T. Matilainen, M. Salminen, and P. Lappalainen. 2004. Cyclase-associated protein 1 (CAP1) promotes cofilin-induced actin dynamics in mammalian nonmuscle cells. Mol. Biol. Cell. 15:2324–2334. - PMC - PubMed
    1. Choidas, A., A. Jungbluth, A. Sechi, J. Murphy, A. Ullrich, and G. Marriott. 1998. The suitability and application of a GFP-actin fusion protein for long-term imaging of the organization and dynamics of the cytoskeleton in mammalian cells. Eur. J. Cell Biol. 77:81–90. - PubMed
    1. Cramer, L.P., M. Siebert, and T.J. Mitchison. 1997. Identification of novel graded polarity actin filament bundles in locomoting heart fibroblasts: implications for the generation of motile force. J. Cell Biol. 136:1287–1305. - PMC - PubMed
    1. Dabiri, G.A., K.K. Turnacioglu, J.M. Sanger, and J.W. Sanger. 1997. Myofibrillogenesis visualized in living embryonic cardiomyocytes. Proc. Natl. Acad. Sci. USA. 94:9493–9498. - PMC - PubMed

Publication types

MeSH terms