. 2006 May 17;25(10):2039-50.
doi: 10.1038/sj.emboj.7601103. Epub 2006 Apr 27.

Genetic analysis of synaptotagmin 2 in spontaneous and Ca2+-triggered neurotransmitter release

Affiliations

Genetic analysis of synaptotagmin 2 in spontaneous and Ca2+-triggered neurotransmitter release

Zhiping P Pang et al. EMBO J. .

Abstract

Synaptotagmin 2 resembles synaptotagmin 1, the Ca2+ sensor for fast neurotransmitter release in forebrain synapses, but little is known about synaptotagmin 2 function. Here, we describe a severely ataxic mouse strain that harbors a single, destabilizing amino-acid substitution (I377N) in synaptotagmin 2. In Calyx of Held synapses, this mutation causes a delay and a decrease in Ca2+-induced but not in hypertonic sucrose-induced release, suggesting that synaptotagmin 2 mediates Ca2+ triggering of evoked release in brainstem synapses. Unexpectedly, we additionally observed in synaptotagmin 2 mutant synapses a dramatic increase in spontaneous release. Synaptotagmin 1-deficient excitatory and inhibitory cortical synapses also displayed a large increase in spontaneous release, demonstrating that this effect was shared among synaptotagmins 1 and 2. Our data suggest that synaptotagmin 1 and 2 perform equivalent functions in the Ca2+ triggering of action potential-induced release and in the restriction of spontaneous release, consistent with a general role of synaptotagmins in controlling 'release slots' for synaptic vesicles at the active zone.


Figures
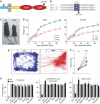
Figure 1
Figure 1
Characterization of synaptotagmin 2I377N mutant mice. (A) Domain structure of synaptotagmin 2; arrow points to position of the I377N substitution. (B) Sequence alignment of WT synaptotagmin 1 and 2 and mutant synaptotagmin 2I377N. (C) Pictures of littermate WT (+/+) and synaptotagmin 2I377N homozygous mutant mice (m/m). (D) Body weights of WT and hetero- and homozygous mutant male and female mice as a function of age (n=10–33). (E) Representative traces of the movements of littermate WT and synaptotagmin 2I377N mutant mice monitored on a force plate. (F) Ataxia indices of eight independent pairs of littermate WT and synaptotagmin 2I377N mutant mice calculated from force-plate traces (***P<0.001). (G) Protein levels in synaptotagmin 2I377N mutant mice (m/m; black) expressed as the percent of WT levels (+/+; gray). Protein levels were determined in three independent pairs of littermate WT and synaptotagmin 2I377N mutant mice using quantitative immunoblotting with 125I-labeled secondary antibodies and PhosphoImager detection. For additional proteins, see Supplementary data. Abbreviations used: syt 1 and syt 2, synaptotagmin 1 and 2; Syb, synaptobrevin; Syp, synaptophysin (*P<0.05). In these and all subsequent figures, data shown are means±s.e.m.'s; statistical significance is assessed with the Student's t-test.
Figure 2
Figure 2
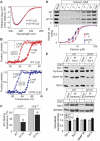
Biochemical characterization of synaptotagmin 2I377N mutant protein. (A, B) CD spectra (A) and thermal denaturation curves (B) of WT and I377N-mutant synaptotagmin 2 C2B domains. Denaturation was monitored by CD at 217 nm without or with 5 mM Ca2+. (C) Mean 50% melting temperature of WT and I377N-mutant C2B-domain without or with 5 mM Ca2+ (*P<0.05). (D) Ca2+-dependent phospholipid binding by the double C2AB-domain fragment from WT and I377N-mutant synaptotagmin 2 (tested as purified GST fusion proteins). Liposomes (25% PS/75% PC) were incubated at the indicated free Ca2+ concentrations with the C2AB-domain fragment of synaptotagmin 2 and the C2-domain of PKCβ (as an internal control); bound C2-domains were measured by SDS–PAGE and Coomassie staining. Upper panel shows a representative Coomassie-stained gel; binding was quantified in multiple independent experiments by scanning of Coomassie-stained gels as shown in lower panel. (E, F) Binding of WT and I337N-mutant synaptotagmin 2 to SNARE complexes analyzed by immunoprecipitations. Synaptotagmin 2 (E) or syntaxin-1 (F) were immunoprecipitated from detergent-solubilized brain extracts from control and synaptotagmin 2I377N mutant mice without or with Ca2+; co-precipitated proteins were examined by immunoblotting (syt 1 and 2=synaptotagmins 1 and 2; Syb 2=synaptobrevin 2). In (F), the amount of synaptotagmins 1 and 2, SNAP-25 and synaptobrevin 2 present in the syntaxin-1 immunoprecipitates in the absence of Ca2+ were quantified using 125I-labeled secondary antibodies and PhosphoImager detection.
Figure 3
Figure 3
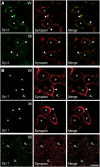
Synaptotagmin 2 but not synaptotagmin 1 is present in Calyx terminals. Panels show double immunofluorescence labeling experiments of brainstem sections from wild-type and synaptotagmin 2I377N mutant mice with antibodies to synaptotagmin 2 (syt 2) and synapsins (A) or to synaptotagmin 1 and synapsins (B). Note that although no synaptotagmin 1 can be detected in wild-type (W) or mutant Calyx terminals (M) in the ventral brainstem, synaptotagmin 1 is abundantly expressed in smaller terminals in the dorsal brainstem (bottom panels in B). Closed arrowheads identify Calyx presynaptic terminals; open arrowheads non-Calyx terminals; *=soma of postsynaptic MNTB neurons. Bar=10 μm.
Figure 4
Figure 4
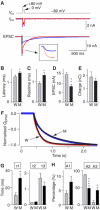
Kinetics of release in Calyx synapses in response to a 50 ms presynaptic depolarization. Simultaneous pre- and postsynaptic voltage-clamp recordings were obtained in brainstem slices from WT and synaptotagmin 2I377N mutant mice at P7–P9 in the presence of 0.1 mM CTZ, 1 mM kynurenic acid and 50 μM D-AP5. (A) Experimental protocol (top gray line) and representative traces of presynaptic Ca2+ currents (ICa) and postsynaptic EPSCs in WT (W; red) and mutant mice (M; blue). In the bottom panels, representative WT and mutant ICa and EPSCs traces are superimposed; inset shows an enlargement of the initial phase of the EPSCs. (BE) Quantitative comparison of EPSCs from WT and synaptotagmin 2I377N mutant synapses: latencies from the onset of the Ca2+ current to 10% of the EPSC (B), 20–80% rise times (C), amplitudes (D) and synaptic charge transfer integrated over 2 s (E; W: n=12; M: n=14 for B–D; W: n=6; M: n=8 for E). (F). Normalized integrals of EPSC charge transfer over 2 s from littermate WT (W; red) and mutant mice (M; blue). The integration traces are fitted by three-exponential functions (black line, r2>0.9999). (G, H). Time constants (G) and fraction (H) of each component from a three-exponential function fitting for each trace of the integral of EPSCs from WT (n=6) and synaptotagmin 2 mutants (n=8).
Figure 5
Figure 5
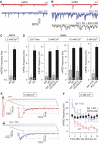
Release evoked by single APs or hypertonic sucrose in Calyx synapses at postnatal day P14. (A) Representative EPSC traces monitored in the presence of bicuculline (10 μM), strychnine (10 μM) and D-AP-5 (50 μM) in response to isolated APs evoked by fiber stimulation (WT=W; red; synaptotagmin 2I377N mutants=M; blue); traces are scaled and superimposed on the right. Below the traces, mEPSC events are indicated as notches. (B) Mean electrical charge transfer (integrated over 100 ms) and amplitude of evoked EPSCs. (C) Frequency of mEPSCs in the 100 ms periods before and after stimulation. (D) Absolute increases in mEPSCs frequency in 100 ms after stimulation (W: n=12; M: n=9). (E) Representative recordings of mEPSCs induced by a 1 s puff of hypertonic sucrose (a glass pipette containing 2 M sucrose positioned ∼5 μm from the Calyx, and puffed the sucrose solution onto the terminal using a 1 s pressure pulse as indicated by the dashed line above the traces) from WT (W; red) and mutant (M; blue). (F) Average charge transfer during hypertonic sucrose-induced mEPSCs from WT (n=4) and mutant (n=4) integrated over 5 s (*P<0.05; **P<0.01; ***P<0.001).
Figure 6
Figure 6
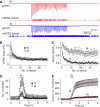
EPSCs evoked by a 50 Hz AP train. (A) Representative traces of EPSCs evoked by 40 APs at 50 Hz (WT, red; synaptotagmin 2I377N mutant, blue). Below the traces, mini events are indicated as notches. (B, C) Absolute (B) and normalized (C) EPSC amplitudes of 40 stimuli at 50 Hz. (D, E) Mini event frequency before, during and after the 50 Hz stimulus train plotted as a function of time as the number of events per 0.1 s interval (D) or as the cumulative number of events after normalization for basal mini release (E; see text for detail). The time of stimulation is indicated by the horizontal bar above the plot (WT, W: n=6, filled symbols; synaptotagmin 2I377N mutant, M: n=5, open symbols).
Figure 7
Figure 7
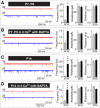
Spontaneous neurotransmitter release in WT and synaptotagmin 21377N mutant neurons. In all panels, representative traces are shown on the left, and summary diagrams for the mini frequency, amplitude and risetimes (20–80% for the calyx; 10–90% for NMJ) on the right. (A, B) Recordings from the calyx at P7–P9 in regular extracellular medium (A; W: n=7; M: n=8) or medium containing 0 mM Ca2+ and 0.1 mM BAPTA-AM (B; W and M: n=6 for both). (C, D) Recordings from the calyx at P14 in regular extracellular medium (C; W: n=8; M: n=9) or medium containing 0 mM Ca2+ and 0.1 mM BAPTA/AM (B; W and M: n=9 and 6, respectively) (*P<0.05; ***P<0.001).
Figure 8
Figure 8
Spontaneous neurotransmitter release at the NMJ. (A, B) Representative traces of mEPPs (A) and summary diagrams of mEPP frequency, amplitude and 10–90% risetimes (B) in diaphragm NMJs from wild-type (W) and synaptotagmin 2I377N mutant mice at P16, recorded in normal Ringer's solution (W: n=57, three mice; M: n=68, three mice). (C, D) Representative traces of mEPPs (C) and summary diagrams of the mEPP frequencies (D) recorded at the indicated Ca2+ concentrations in NMJs from control (C) and synaptotagmin 2I377N mutant mice (M) at P22. Note that the 0 Ca2+ condition included BAPTA-AM to remove nerve terminal Ca2+ (n=25–30, two animals each genotype) (***P<0.001 in B and D).
Figure 9
Figure 9
Spontaneous release in synaptotagmin 1-deficient cortical neurons. (A, B) Representative spontaneous mEPSCs (A) and mIPSCs (B) recorded in the presence of acutely added TTX (1 μM) from WT (red) and synaptotagmin 1-deficient neurons (blue). In (B), mIPSCs were also recorded from synaptotagmin 1-deficient neurons preincubated for 5 min in 0.1 mM EGTA-AM (black; holding potential=−70 mV; scale bars apply to all traces). (C, D) Average mEPSC (C) and mIPSC (D) frequencies in WT and synaptotagmin 1-deficient neurons. Extracellular Ca2+ concentrations are indicated on the top; number of cells analyzed are shown in the bars. The 2 and 10 mM Ca2+ experiments were also carried out after a 5 min preincubation of neurons in 0.1 mM EGTA-AM. The 2 mM Ca2+ data on the right were obtained in neurons that were incubated with 1 μM TTX for 4 days prior to the recordings. (E) Representative IPSCs evoked by two closely spaced (0.1 s interval) APs in the presence of AP5 and CNQX. Insets illustrate individual mini events observed at the ends of evoked responses. (F) Plot of the average mIPSC frequency in WT and synaptotagmin 1-deficient neurons after the neurons were stimulated by two APs separated by 0.1 s. Frequencies were calculated in 1 s bins starting 0.5 s after the second AP in the train. Data are from three different WT, synaptotagmin 1-deficient neurons and synaptotagmin 1-deficient neurons preincubated with 0.1 mM EGTA-AM (*P<0.05; **P<0.01; ***P<0.001).

Similar articles

Cited by

References

    1. Berton F, Iborra C, Boudier JA, Seagar MJ, Marqueze B (1997) Developmental regulation of synaptotagmin I, II, III, and IV mRNAs in the rat CNS. J Neurosci 17: 1206–1216 - PMC - PubMed
    1. Borst JG, Helmchen F, Sakmann B (1995) Pre- and postsynaptic whole-cell recordings in the medial nucleus of the trapezoid body of the rat. J Physiol 489 (Part 3): 825–840 - PMC - PubMed
    1. Broadie K, Bellen HJ, DiAntonio A, Littleton JT, Schwarz TL (1994) Absence of synaptotagmin disrupts excitation–secretion coupling during synaptic transmission. Proc Natl Acad Sci USA 91: 10727–10731 - PMC - PubMed
    1. DiAntonio A, Schwarz TL (1994) The effect on synaptic physiology of synaptotagmin mutations in Drosophila. Neuron 12: 909–920 - PubMed
    1. Earles CA, Bai J, Wang P, Chapman ER (2001) The tandem C2 domains of synaptotagmin contain redundant Ca2+ binding sites that cooperate to engage t-SNAREs and trigger exocytosis. J Cell Biol 154: 1117–1123 - PMC - PubMed

MeSH terms