. 2006 May;80(10):4801-19.
doi: 10.1128/JVI.80.10.4801-4819.2006.

Lymphoma cell apoptosis in the liver induced by distant murine cytomegalovirus infection

Affiliations

Lymphoma cell apoptosis in the liver induced by distant murine cytomegalovirus infection

Katja C Erlach et al. J Virol. 2006 May.

Abstract

Cytomegalovirus (CMV) poses a threat to the therapy of hematopoietic malignancies by hematopoietic stem cell transplantation, but efficient reconstitution of antiviral immunity prevents CMV organ disease. Tumor relapse originating from a minimal residual leukemia poses another threat. Although a combination of risk factors was supposed to enhance the incidence and severity of transplantation-associated disease, a murine model of a liver-adapted B-cell lymphoma has previously shown a survival benefit and tumor growth inhibition by nonlethal subcutaneous infection with murine CMV. Here we have investigated the underlying antitumoral mechanism. Virus replication proved to be required, since inactivated virions or the highly attenuated enhancerless mutant mCMV-DeltaMIEenh did not impact the lymphoma in the liver. Surprisingly, the dissemination-deficient mutant mCMV-DeltaM36 inhibited tumor growth, even though this virus fails to infect the liver. On the other hand, various strains of herpes simplex viruses consistently failed to control the lymphoma, even though they infect the liver. A quantitative analysis of the tumor growth kinetics identified a transient tumor remission by apoptosis as the antitumoral effector mechanism. Tumor cell colonies with cells surviving the CMV-induced "apoptotic crisis" lead to tumor relapse even in the presence of full-blown tissue infection. Serial transfer of surviving tumor cells did not indicate a selection of apoptosis-resistant genetic variants. NK cell activity of CD49b-expressing cells failed to control the lymphoma upon adoptive transfer. We propose the existence of an innate antitumoral mechanism that is triggered by CMV infection and involves an apoptotic signal effective at a distant site of tumor growth.


Figures
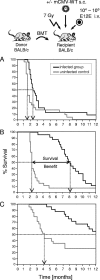
FIG. 1.
FIG. 1.
Effect of the E12E lymphoma cell dose on the median survival time. Syngeneic BMT with BALB/c mice as donors and recipients was performed with 107 donor bone marrow cells at 1 day after a 7-Gy hematoablative conditioning of the recipients. Graded doses of E12E cells were given i.v. together with the bone marrow cells, followed by subcutaneous (s.c.) (intraplantar) infection with 105 PFU of mCMV-WT. (A) 106 E12E cells; (B) 105 E12E cells; (C) 104 E12E cells. Survival was monitored over a period of 12 months for 25 recipients per group. Shown are Kaplan-Meier plots with black and gray lines representing infected and uninfected groups, respectively. Dotted arrows mark the median survival times.
FIG. 2.
FIG. 2.
Presentation of IE1 peptide by E12E cells. IE1 epitope-specific CD8 T cells (IE1-CTL) were used as effector cells in an IFN-γ-based ELISPOT assay to detect a possible presentation of the IE1 peptide on E12E cells that were either loaded exogenously with synthetic IE1 peptide at the indicated peptide concentrations or exposed to viruses mCMV-IE1-L176A and mCMV-IE1-A176L at a dose of 4 PFU/cell. Group ⊘, uninfected E12E stimulator cells with no peptide added. The number of responding, spot-forming IE1-CTL was counted for seedings of 400, 200, 100, and 50 IE1-CTL. Black bars indicate the most probable numbers per 100 IE1-CTL as determined by intercept-free linear regression analysis. The error bars indicate the upper 95% confidence limits. P values for nonlinearity (null hypothesis) were <0.001 throughout.
FIG. 3.
FIG. 3.
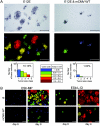
Lymphoma imaging and computer-assisted quantitation. BALB/c mice were treated like BMT recipients (Fig. 1), except that no BMT was performed. (A) Effect of mCMV-WT on the E12E lymphoma. E12E cells (106) were administered i.v. at ∼1 h before infection. (Left column) No infection; (right column), subcutaneous (s.c.) (intraplantar) infection with 105 PFU of mCMV-WT. Lymphoma colonies in the liver were detected on day 12 by IHC specific for the cell surface antigen CD45R (black staining with light hematoxylin counterstaining). Bar markers represent 500 μm and the displayed tissue section area measures ∼4 mm2. Five tumor size classes were defined as indicated, and the colonies were color coded correspondingly in blue, green, yellow, bright red, and Bordeaux red with log 2-increasing size. Quantification was performed for the displayed tissue section area by counting the number of tumor colonies for each tumor size class, depicted as a “tumor size-frequency diagram.” The percentages of liver tissue area covered by tumor are indicated in the tumor size-frequency diagrams. (B) Effect of mCMV-WT on T-cell lymphomas. Shown are the color-coded CD45R IHC images of liver tissue sections on days 6 and 9 after i.v. tumor cell administration and intraplantar infection with 105 PFU of mCMV-WT. ⊘, uninfected control group. (Left panel) 105 cells of the attenuated lymphoma ESb-MP; (right panel) 103 cells of the highly aggressive lymphoma ESb-L-CI. Bar markers represent 500 μm.
FIG. 4.
FIG. 4.
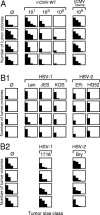
Virus dose dependence and specificity of E12E growth inhibition. For the experimental protocol and the principle of lymphoma quantification, see the legend for Fig. 3A; here, however, tumor colonies were counted in a more representative tissue section area of 100 mm2. Throughout, 106 E12E cells were administered i.v., and infections were performed subcutaneously (intraplantar) with the indicated viruses and virus doses. Groups ⊘, no infection. (A) Virus dose dependence and betaherpesvirus host species specificity. Infection doses in PFU are indicated. IHC for lymphoma quantification in liver tissue sections was performed on day 12. (B1) Infection with 104 PFU of the indicated virulent strains of the alphaherpesviruses HSV-1 and HSV-2. Because of high lethality, the readout was on day 7. Accordingly, only one tumor size class is occupied in the tumor size-frequency diagrams. (B2) Infection with 105 PFU of the indicated attenuated strains of HSV-1 and HSV-2. The readout was on day 12. Each tumor size-frequency diagram represents the result for an individual mouse, with four mice tested per experimental group.
FIG. 5.
FIG. 5.
Dissemination of HSV-1 strain JES to the liver. Intraplantar infection of the immunocompromised recipients (protocol as for Fig. 3A) was performed with 103 PFU of HSV-1 strain JES. On day 11, a prefinal stage of viral disease, infected liver cells and E12E lymphoma cells were detected in serial 2-μm liver tissue sections. (A) Infection of perivascular hepatocytes detected with anti-HSV polyclonal immunoglobulin. Brown DAB staining with hematoxylin counterstaining. A1, overview; A2, detail. (B) Neighboring section with E12E lymphoma colonies detected with MAb directed against cell surface antigen CD45R. Black DAB-nickel staining with hematoxylin counterstaining. B1, overview; B2, detail. Bar markers represent 100 μm. Brown and black arrows highlight the location of foci of infection and of lymphoma colonies, respectively. Note that areas with intense hematoxylin staining correspond to tumor localization.
FIG. 6.
FIG. 6.
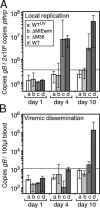
Local virus replication and viremic dissemination. For the protocol, see legend for Fig. 3A. (A) Virus replication at the intraplantar site of inoculation. The increase in viral copy numbers was monitored by real-time quantitative PCR specific for the M55/gB gene and normalized to the copy number of the autosomal cellular gene pthrp. (B) Viral genomes present in peripheral blood. The increase in viral copy numbers was monitored as described above, except that data were normalized to a defined volume to take account of increasing leukocytopenia as a result of the 7-Gy γ irradiation. Virus doses were 105 PFU or PFU equivalents throughout. (a) WTUV, 254-nm UV light-inactivated mCMV-WT; (b) ΔMIEenh, enhancerless mutant mCMV-ΔMIEenh; (c) ΔM36, mutant virus mCMV-ΔM36 lacking the antiapoptotic gene M36; (d) WT, mCMV-WT. Bars represent median values of triplicates with the error bars representing the ranges. The dotted lines indicate the significance limit of replication as defined by the highest value detected for replication-incompetent mCMV-WTUV representing inactivated inoculum genomes.
FIG. 7.
FIG. 7.
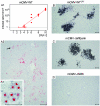
Lymphoma growth and virus replication in the liver. The experiment was the same as that shown in Fig. 6, with 106 E12E lymphoma cells administered i.v. and intraplantar infection/inoculation of 7-Gy-γ-irradiated BALB/c mice with the viruses indicated. Shown is two-color IHC analysis for the simultaneous detection of E12E cells (black staining of CD45R) and of infected hepatocytes (red staining of intranuclear IE1 protein pp76/89) in liver tissue sections. Counterstaining was performed with hematoxylin. (A1) Kinetics of mCMV-WT infection of the liver. The number of infected hepatocytes per 10 mm2 (nt) was determined for three individual recipients per time point and is indicated by dots with the median values marked. Log-linear regression analysis reveals the time point of first detectability of liver infection from the point of intersection between the calculated regression line, log nt = at + log n0, and the line log nt = 0 (1 infected cell per detection area; dotted line). The horizontal bar represents the 95% confidence interval of the time point of first detectability. d.p.i., day postinfection. (A2). Histological image of liver infection on day 10. The bar marker represents 100 μm. The arrow points to a group of infected hepatocytes that is resolved to greater detail in A3. (A3) Group of infected hepatocytes identified by intranuclear inclusion bodies containing IE1 protein pp76/89. The bar marker represents 50 μm. (B through D) Infection/inoculation with the viruses indicated, and two-color IHC performed on day 12. Bar markers represent 100 μm.
FIG. 8.
FIG. 8.
Effect of virion attachment/entry on E12E growth in cell culture and on in vivo tumorigenesis. (A) Kinetics of tumor growth in cell culture. E12E cells were seeded in triplicate with a starting cell number of 2 × 10⁵ cells per ml of a 2-ml culture. At 12 h after seeding (arrows), mCMV-WTUV or mCMV-WT was added in a dose equivalent to 4 PFU per cell. Tumor cell numbers were determined from aliquots taken every 12 h and are expressed as tumor cells per ml. Log-linear regression analysis was performed to determine the DT (95% confidence interval of DT). (B) In vivo tumorigenesis. E12E cells were preincubated with mCMV-WTUV or mCMV-ΔMIEenh for 3 h at 37°C at doses equivalent to 4 PFU per cell, and tumor burden in the liver (size-frequency diagrams for 100 mm2) of four individual mice per group was assessed on day 12 after i.v. transfer of 106 pretreated E12E cells.
FIG. 9.
FIG. 9.
Apoptotic crisis of E12E lymphoma cells in the liver. (A) Early kinetics of tumor growth in the liver: raw data. For the protocol, see the legend to Fig. 3A. The number of tumor cells was determined by counting of IHC-stained CD45R+ cells in representative 50-mm2 areas of liver tissue sections. Dots represent data from four individual recipients per time point and group (red symbol, infected with mCMV-WT; black symbol, uninfected) with the median values and ranges indicated by horizontal and vertical bars, respectively. The asterisk marks the individual recipient for which liver histology is shown in panel C. (B) Early kinetics of tumor growth in the liver: results of log-linear regression analysis of the raw data shown in panel A. The plot highlights the monophasic tumor growth in the uninfected group and the triphasic (phases I, II, and III) tumor development in the infected group. DT (95% confidence interval of DT) and transmigration rate (TMR) (95% confidence interval of TMR) are shown. (C) Documentation of tumor-selective apoptosis in the phase of tumor remission (phase II; day 4). For the individual recipient marked by an asterisk in panel A, apoptotic tumor cells are shown in a liver tissue section by two-color IHC with black staining of cell-surface CD45R and red staining of intracellular active caspase 3. The bar marker represents 50 μm. (D) Kinetics of E12E apoptosis. Apoptotic tumor cells (active caspase 3-expressing CD45R+ cells) were counted for representative 50-mm2 areas of liver tissue sections from four individual recipients per time point and group (red bars, recipients infected with mCMV-WT; black bars, uninfected recipients). (Left panel) Absolute number of apoptotic tumor cells. (Right panel) Percentage of apoptotic tumor cells among all CD45R+ tumor cells. Bars represent the median values and error bars show the range. d, day.
FIG. 10.
FIG. 10.
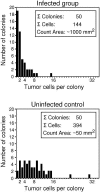
Tumor colony size distribution at the phase II-to-phase III transition point. For the experiment shown in Fig. 9, the CD45R-IHC data from day 5, the transition point from transient remission to relapse, were evaluated to reveal the numbers of E12E cells in surviving lymphoma colonies. Size (cell number)-frequency plots for the infected group (top) and for the uninfected control group (bottom) are normalized to 50 colonies per group present in ∼1,000-mm2 and ∼50-mm2 areas of liver tissue sections, respectively. This indicates an ∼20-fold difference in the total number of lymphoma colonies and an ∼50-fold difference in the total number of lymphoma cells. Note that the abscissa has to be interpreted as ≥n tumor cells per colony.
FIG. 11.
FIG. 11.
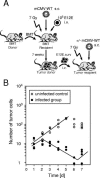
Serial transfer of ex tumore-recovered E12E cells. (A) Experimental regimen. BMT was performed as explained for Fig. 1 and followed by i.v. administration of 106 E12E cells and intraplantar infection with 105 PFU of mCMV-WT. After 7 weeks, E12E.surv cells (cells that have survived the apoptotic crisis) were recovered from relapsed, macroscopically visible tumor noduli (∼3 mm in diameter), expanded in cell culture by three passages in the presence of G418, and transferred i.v. into 7-Gy-γ-irradiated indicator recipients. (B) Early kinetics of E12E.surv tumor growth. At the indicated time points after transfer of 106 E12E.surv cells, liver-resident IHC-stained CD45R+ tumor cells were counted in representative 50-mm2 areas of liver tissue sections. Dots represent data from individual recipients per time point and group (closed circles, indicator recipients infected with 105 PFU of mCMV-WT; open circles, uninfected indicator recipients) with the calculated log-linear regression lines indicated.
FIG. 12.
FIG. 12.
Acquisition of resistance by developing E12E cell colonies. (A) Kinetics of the in vivo susceptibility of E12E lymphoma cells to virus-induced apoptosis. (A1) Experimental design. E12E cells were administered i.v. into immunocompromised indicator recipients according to the protocol explained for Fig. 3A. Recipient mice either were left uninfected (group ⊘), were infected with mCMV-WT shortly after tumor cell transfer (group d0), or were infected with a delay increasing from 24 h (group d1) to 5 days (group d5). Time points of infection and of 7-Gy γ irradiation are indicated by closed and open arrowheads, respectively. (A2) For all groups, tumor burden in the liver was assessed on day 12 as explained for Fig. 3A, except that quantitation was based on 100 mm2 of liver tissue sections. Size-frequency diagrams are shown for four individual recipients per group. (B) Continuance of the apoptotic environment after infection. (B1) Experimental design. Intravenous administration of E12E cells into immunocompromised mice was performed shortly after infection (group d 0) or was preceded by infection for 24 h (group d-1) to 6 days (group d-6). A control group immunocompromised on day −1 received tumor cells on day 0 but was left uninfected (group ⊘). Time points of infection and of 7-Gy γ irradiation are indicated by closed and open arrowheads, respectively. (B2) For all groups, tumor burden in the liver was assessed after 5 days of tumor growth. This early time point was imposed by CMV disease in the groups with the most advanced infection. Dots represent tumor burden in representative 100-mm2 areas of liver tissue sections of individual recipients. The median values are marked.
FIG. 13.
FIG. 13.
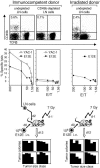
Tumor-lytic NK cells fail to control E12E lymphoma growth in the liver. LN cells from the popliteal LN were isolated on day 4 after intraplantar infection with 105 PFU of mCMV-WT of either 7-Gy-γ-irradiated (n = 30 LNs; 8.4 × 10⁴ cells per LN) or immunocompetent (n = 5 LNs; 8.6 × 10⁶ cells per LN) BALB/c mice. An aliquot of the LN cells from the immunocompetent donors was depleted of CD49b-expressing cells by negative immunomagnetic cell sorting. (Top panel) Two-color cytofluorometric analysis of the expression of CD49b and TCR β-chain. The proportion of CD49b+TCR NK cells is indicated in the upper left quadrants. Data are shown by two-dimensional dot plots with 30,000 cells analyzed and 5,000 cells (dots) displayed. (Center panel) Lytic activity of the LN cells against E12E lymphoma cells and the prototypic NK-sensitive YAC-1 lymphoma cells at the effector-to-target cell ratios (E/T) indicated. Dots represent mean values of triplicate assay cultures. (Bottom panel) Undepleted day 4 LN cells (105) (corresponding to an effector-to-target cell ratio of 100) derived from the infected, immunocompetent donors were transferred i.v. into immunocompromised mice at day 2 after i.v. administration of 106 E12E lymphoma cells. Recipients with no LN cell transfer served as a control. Each lymphoma size-frequency diagram (CD45R IHC staining) for four individual recipients per group represents 100 mm2 of liver tissue sections on day 12.
FIG. 14.
FIG. 14.
Concluding model. See text in Discussion for a detailed explanation. A layer of endothelial cells separates the vascular/sinusoidal compartment (rose colored) and the intrahepatic compartment (yellow). Lymphoma cells are pictured in stages of endothelial transmigration (1), interphase (2), mitosis (3), small colony formation (4), and apoptosis (5) and as apoptotic bodies/vesicles (6). The red virus symbols indicate productive infection of liver parenchyma.

Similar articles

Cited by

References

    1. Almasan, A., and A. Ashkenazi. 2003. Apo2L/TRAIL: apoptosis signaling, biology, and potential for cancer therapy. Cytokine Growth Factor Rev. 14:337-348. - PubMed
    1. Alterio de Goss, M., R. Holtappels, H.-P. Steffens, J. Podlech, P. Angele, L. Dreher, D. Thomas, and M. J. Reddehase. 1998. Control of cytomegalovirus in bone marrow transplantation chimeras lacking the prevailing antigen-presenting molecule in recipient tissues rests primarily on recipient-derived CD8 T cells. J. Virol. 72:7733-7744. - PMC - PubMed
    1. Andoniou, C. E., D. M. Andrews, M. Manzur, P. Ricciardi-Castagnoli, and M. A. Degli-Esposti. 2004. A novel checkpoint in the Bcl-2-regulated apoptotic pathway revealed by murine cytomegalovirus infection of dendritic cells. J. Cell Biol. 166:827-837. - PMC - PubMed
    1. Arase, H., T. Saito, J. H. Phillips, and L. L. Lanier. 2001. Cutting edge: the mouse NK cell-associated antigen recognized by DX5 monoclonal antibody is CD49b (a2 integrin, very late antigen-2). J. Immunol. 167:1141-1144. - PubMed
    1. Aurrand-Lions, M., C. Johnson-Leger, and B. A. Imhof. 2002. The last molecular fortress in leukocyte trans-endothelial migration. Nat. Immunol. 3:116-118. - PubMed

Publication types

MeSH terms

LinkOut - more resources