A base-excision DNA-repair protein finds intrahelical lesion bases by fast sliding in contact with DNA
- PMID: 16585517
- PMCID: PMC1458645
- DOI: 10.1073/pnas.0509723103
A base-excision DNA-repair protein finds intrahelical lesion bases by fast sliding in contact with DNA
Abstract
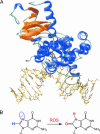
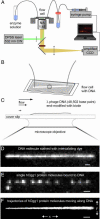
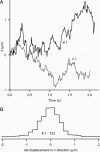
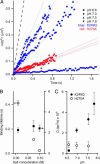
A central mystery in the function of site-specific DNA-binding proteins is the detailed mechanism for rapid location and binding of target sites in DNA. Human oxoguanine DNA glycosylase 1 (hOgg1), for example, must search out rare 8-oxoguanine lesions to prevent transversion mutations arising from oxidative stress. Here we report high-speed imaging of single hOgg1 enzyme molecules diffusing along DNA stretched by shear flow. Salt-concentration-dependent measurements reveal that such diffusion occurs as hOgg1 slides in persistent contact with DNA. At near-physiologic pH and salt concentration, hOgg1 has a subsecond DNA-binding time and slides with a diffusion constant as high as 5 x 10(6) bp(2)/s. Such a value approaches the theoretical upper limit for one-dimensional diffusion and indicates an activation barrier for sliding of only 0.5 kcal/mol (1 kcal = 4.2 kJ). This nearly barrierless Brownian sliding indicates that DNA glycosylases locate lesion bases by a massively redundant search in which the enzyme selectively binds 8-oxoguanine under kinetic control.
Conflict of interest statement
Conflict of interest statement: No conflicts declared.
Figures


Similar articles
-
AP-Endonuclease 1 Accelerates Turnover of Human 8-Oxoguanine DNA Glycosylase by Preventing Retrograde Binding to the Abasic-Site Product.Biochemistry. 2017 Apr 11;56(14):1974-1986. doi: 10.1021/acs.biochem.7b00017. Epub 2017 Mar 31. Biochemistry. 2017. PMID: 28345889 Free PMC article.
-
Structure of a repair enzyme interrogating undamaged DNA elucidates recognition of damaged DNA.Nature. 2005 Mar 31;434(7033):612-8. doi: 10.1038/nature03458. Nature. 2005. PMID: 15800616
-
Step-by-step mechanism of DNA damage recognition by human 8-oxoguanine DNA glycosylase.Biochim Biophys Acta. 2014 Jan;1840(1):387-95. doi: 10.1016/j.bbagen.2013.09.035. Epub 2013 Oct 3. Biochim Biophys Acta. 2014. PMID: 24096108
-
Mechanism of recognition and repair of damaged DNA by human 8-oxoguanine DNA glycosylase hOGG1.Biochemistry (Mosc). 2011 Jan;76(1):118-30. doi: 10.1134/s0006297911010123. Biochemistry (Mosc). 2011. PMID: 21568844 Review.
-
Insights into the glycosylase search for damage from single-molecule fluorescence microscopy.DNA Repair (Amst). 2014 Aug;20:23-31. doi: 10.1016/j.dnarep.2014.01.007. Epub 2014 Feb 20. DNA Repair (Amst). 2014. PMID: 24560296 Free PMC article. Review.
Cited by
-
Thymine DNA glycosylase combines sliding, hopping, and nucleosome interactions to efficiently search for 5-formylcytosine.Nat Commun. 2024 Oct 25;15(1):9226. doi: 10.1038/s41467-024-53497-7. Nat Commun. 2024. PMID: 39455577 Free PMC article.
-
Single-molecule DNA repair in live bacteria.Proc Natl Acad Sci U S A. 2013 May 14;110(20):8063-8. doi: 10.1073/pnas.1301804110. Epub 2013 Apr 29. Proc Natl Acad Sci U S A. 2013. PMID: 23630273 Free PMC article.
-
Single-stranded DNA scanning and deamination by APOBEC3G cytidine deaminase at single molecule resolution.J Biol Chem. 2012 May 4;287(19):15826-35. doi: 10.1074/jbc.M112.342790. Epub 2012 Feb 23. J Biol Chem. 2012. PMID: 22362763 Free PMC article.
-
Dynamics of lesion processing by bacterial nucleotide excision repair proteins.Prog Mol Biol Transl Sci. 2012;110:1-24. doi: 10.1016/B978-0-12-387665-2.00001-8. Prog Mol Biol Transl Sci. 2012. PMID: 22749140 Free PMC article. Review.
-
Sequence-dependent sliding kinetics of p53.Proc Natl Acad Sci U S A. 2012 Oct 9;109(41):16552-7. doi: 10.1073/pnas.1120452109. Epub 2012 Sep 25. Proc Natl Acad Sci U S A. 2012. PMID: 23012405 Free PMC article.
References
Publication types
MeSH terms
Substances
Grants and funding
LinkOut - more resources
Full Text Sources
Other Literature Sources
Research Materials

