. 2006 Mar;5(3):602-10.
doi: 10.1158/1535-7163.MCT-05-0317.

Differential effects of bryostatin 1 and 12-O-tetradecanoylphorbol-13-acetate on the regulation and activation of RasGRP1 in mouse epidermal keratinocytes

Affiliations

Differential effects of bryostatin 1 and 12-O-tetradecanoylphorbol-13-acetate on the regulation and activation of RasGRP1 in mouse epidermal keratinocytes

Matthew C Tuthill et al. Mol Cancer Ther. 2006 Mar.

Abstract

The antitumor agent bryostatin 1 and the tumor-promoting phorbol esters function as structural mimetics of the second lipid messenger diacylglycerol (DAG) by binding to the C1 domain of DAG receptors. However, bryostatin 1 and the phorbol esters often differ in their cellular actions. In mouse skin, the phorbol ester 12-O-tetradecanoylphorbol-13-acetate (TPA) is a potent tumor promoter, whereas bryostatin 1 lacks this activity and antagonizes the tumor-promoting effects of TPA. Although protein kinase C mediates many of the effects of DAG on skin, the exact mechanisms responsible for the biology of bryostatin 1 and TPA in the epidermis have not been elucidated. We recently reported that the novel DAG receptor RasGRP1 is expressed in mouse keratinocytes and mediates TPA-induced Ras activation. This finding prompted us to examine the regulation of RasGRP1 by bryostatin 1. We found that whereas TPA induced translocation of RasGRP1 to both the plasma and internal membranes of the keratinocytes, bryostatin 1 recruited RasGRP1 only to internal membranes and the nuclear envelope. In addition, TPA led to a concentration-dependent down-regulation of RasGRP1, whereas bryostatin 1 failed to induce full RasGRP1 down-regulation. Interestingly, bryostatin 1 was less effective than TPA at activating Ras. The results presented here suggest the possibility that a differential modulation of RasGRP1 by bryostatin 1 compared with TPA could participate in the disparate responses of the epidermal cells to both DAG analogues. This result may have implications in the understanding of the antitumor effects of bryostatin 1 in the skin.


Figures
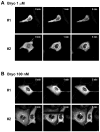
Figure 1
Figure 1
Real-time translocation of RasGRP1 in response to Bryo and TPA in mouse keratinocytes. SP-1 cells were perfused for 5 min with either 1 μM or 100 nM Bryo (A and B) or TPA (C and D). Images were recorded every minute using a scanning laser confocal microscope. Results shown are for 0, 1 and 5 minutes only. Pictures are from two experiments (#1 and #2) from a total of three to four independent experiments with each DAG analog.
Figure 1
Figure 1
Real-time translocation of RasGRP1 in response to Bryo and TPA in mouse keratinocytes. SP-1 cells were perfused for 5 min with either 1 μM or 100 nM Bryo (A and B) or TPA (C and D). Images were recorded every minute using a scanning laser confocal microscope. Results shown are for 0, 1 and 5 minutes only. Pictures are from two experiments (#1 and #2) from a total of three to four independent experiments with each DAG analog.
Figure 2
Figure 2
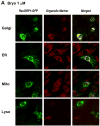
Subcellular localization of RasGRP1 in response to Bryo and TPA. SP-1 cells expressing RasGRP1-GFP were treated with either 1 μM Bryo (A) or 1 μM TPA (B) and labeled with different organelle markers for staining of Golgi (brefeldin A), ER calreticulin), mitochondria (Mito; MitoTracker®) and lysosomes (Lyso; LysoTracker®), as indicated in “Material and Methods”. The green images represent the RasGRP1-GFP protein (left panels), and the red images represent the organelle markers (middle panels). Co-localization of RasGRP1-GFP with the organelle markers is represented by a yellow region within each cell in the merged images (right panels). The fluorescence was detected using a confocal microscope. Images shown are from one experiment. Similar results were observed in two to three independent experiments.
Figure 2
Figure 2
Subcellular localization of RasGRP1 in response to Bryo and TPA. SP-1 cells expressing RasGRP1-GFP were treated with either 1 μM Bryo (A) or 1 μM TPA (B) and labeled with different organelle markers for staining of Golgi (brefeldin A), ER calreticulin), mitochondria (Mito; MitoTracker®) and lysosomes (Lyso; LysoTracker®), as indicated in “Material and Methods”. The green images represent the RasGRP1-GFP protein (left panels), and the red images represent the organelle markers (middle panels). Co-localization of RasGRP1-GFP with the organelle markers is represented by a yellow region within each cell in the merged images (right panels). The fluorescence was detected using a confocal microscope. Images shown are from one experiment. Similar results were observed in two to three independent experiments.
Figure 3
Figure 3
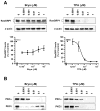
Activation of Ras by Bryo and TPA in mouse keratinocytes. Primary mouse keratinocytes were serum-starved overnight and then treated for 5 min with either DMSO (vehicle), TPA, or Bryo. RasGTP was precipitated by the pull-down technique as described in “Material and Methods”. The intensities of the Western blot bands were determined by densitometry, and the results for RasGTP were normalized by the total amount of Ras in each lane and referred as “Relative RasGTP levels”. The levels of total Ras and RasGRP1 were measured from aliquots of the total lysate used in the pull-down experiment. A, Effect of 1 μM Bryo and 1 μM TPA. Western blot results are from a representative experiments. The bar graph shows the mean ± S.E.M. of 4 independent experiments. **p<0.01 vs. DMSO, *p<0.05 vs. DMSO, #p<0.05 vs. TPA. B, Concentration-response curves for Ras activation upon Bryo and TPA treatment. The graph shows the mean ± S.E.M. of three to four independent experiments **p<0.01 vs. DMSO, *p<0.05 vs. DMSO.
Figure 4
Figure 4
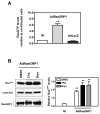
Effect of RasGRP1 overexpression on Ras activation in mouse keratinocytes. A, Primary mouse keratinocytes were infected for 24 h with either AdRasGRP1 or AdLacZ. RasGTP was precipitated by the pull-down technique as described in “Material and Methods”. The intensities of the Western blot bands for non-infected (NI), AdRasGRP1-infected (AdRasGRP1) and AdLacZ-infected (AdLacZ) keratinocytes were determined by densitometry, and the results for RasGTP were normalized by the total amount of Ras in each lane, and expressed as fold-increase of the relative levels of RasGTP in NI cells. The bar graph shows the mean ± S.E.M. of at least four independent experiments. **p<0.01 vs. NI. B and C, After overnight serum starvation, cells infected with either AdRasGRP1 (B) or AdLacZ (C) were treated for 5 min with either DMSO, 1 μM TPA or 1 μM Bryo for 5 minutes. The intensities of the Western blot bands were determined by densitometry, and the results for RasGTP were normalized by the total amount of Ras in each lane and referred as “Relative RasGTP levels”. The levels of total Ras and RasGRP1 were measured from aliquots of the total lysate used in the pull-down experiment. Western blot results are from a representative experiment. The bar graph shows the mean ± S.E.M. of at least five independent experiments. B: **p<0.01 vs. NI; C: **p<0.01 vs. DMSO, *p<0.05 vs. DMSO, #p<0.01 vs. TPA.
Figure 4
Figure 4
Effect of RasGRP1 overexpression on Ras activation in mouse keratinocytes. A, Primary mouse keratinocytes were infected for 24 h with either AdRasGRP1 or AdLacZ. RasGTP was precipitated by the pull-down technique as described in “Material and Methods”. The intensities of the Western blot bands for non-infected (NI), AdRasGRP1-infected (AdRasGRP1) and AdLacZ-infected (AdLacZ) keratinocytes were determined by densitometry, and the results for RasGTP were normalized by the total amount of Ras in each lane, and expressed as fold-increase of the relative levels of RasGTP in NI cells. The bar graph shows the mean ± S.E.M. of at least four independent experiments. **p<0.01 vs. NI. B and C, After overnight serum starvation, cells infected with either AdRasGRP1 (B) or AdLacZ (C) were treated for 5 min with either DMSO, 1 μM TPA or 1 μM Bryo for 5 minutes. The intensities of the Western blot bands were determined by densitometry, and the results for RasGTP were normalized by the total amount of Ras in each lane and referred as “Relative RasGTP levels”. The levels of total Ras and RasGRP1 were measured from aliquots of the total lysate used in the pull-down experiment. Western blot results are from a representative experiment. The bar graph shows the mean ± S.E.M. of at least five independent experiments. B: **p<0.01 vs. NI; C: **p<0.01 vs. DMSO, *p<0.05 vs. DMSO, #p<0.01 vs. TPA.
Figure 5
Figure 5
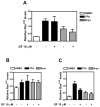
Effect of PKC inhibition on Ras activation by Bryo and TPA in mouse keratinocytes. Primary mouse keratinocytes, either control (A) or infected for 24 h with AdRasGRP1 (B) or AdLacZ (C), were serum-starved overnight followed by a 5-min treatment with either DMSO (vehicle), 1 μM TPA, or 1 μM Bryo. When indicated, cells were preincubated for 30 min with 10 μM GF109203X (GF). RasGTP was precipitated by the pull-down technique as described in “Material and Methods”. The intensities of the RasGTP bands were determined by densitometry, and then normalized by the total amount of Ras in each lane and referred as “Relative RasGTP levels”. The bar graph shows the mean ± S.E.M. of at least three independent experiments.
Figure 6
Figure 6
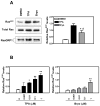
Downregulation of RasGRP1, PKCδ and PKCα in response to Bryo and TPA in mouse keratinocytes. Primary mouse keratinocytes were incubated with increasing concentrations of either TPA, Bryo, or both compounds for 24 hours. A, Levels of RasGRP1 were detected by Western blot analysis of total cell lysates. The intensities of the RasGRP1 bands were measured by densitometry, and expressed as percentage of RasGRP1 in the control, untreated cells. Each data point shown represents the mean ± S.E.M. of at least four independent experiments. Curve analysis for TPA-induced downregulation was done using a sigmoidal-logistic fit. B, Western blot analysis of PKCα and PKCδ in total lysates from keratinocytes treated with either Bryo or TPA. The results are representative of three independent experiments. C, Primary keratinocytes were treated with DMSO or with 1 μM TPA and the indicated concentrations of Bryo for 24 hours. Total samples were prepared and RasGRP1 was detected by Western blot. The results are representative of three independent experiments. Actin is included as a loading control.
Figure 6
Figure 6
Downregulation of RasGRP1, PKCδ and PKCα in response to Bryo and TPA in mouse keratinocytes. Primary mouse keratinocytes were incubated with increasing concentrations of either TPA, Bryo, or both compounds for 24 hours. A, Levels of RasGRP1 were detected by Western blot analysis of total cell lysates. The intensities of the RasGRP1 bands were measured by densitometry, and expressed as percentage of RasGRP1 in the control, untreated cells. Each data point shown represents the mean ± S.E.M. of at least four independent experiments. Curve analysis for TPA-induced downregulation was done using a sigmoidal-logistic fit. B, Western blot analysis of PKCα and PKCδ in total lysates from keratinocytes treated with either Bryo or TPA. The results are representative of three independent experiments. C, Primary keratinocytes were treated with DMSO or with 1 μM TPA and the indicated concentrations of Bryo for 24 hours. Total samples were prepared and RasGRP1 was detected by Western blot. The results are representative of three independent experiments. Actin is included as a loading control.

Similar articles

Cited by

References

    1. Pettit GR, Herald CL, Doubek DL, Herald DL, Arnold E, Clardy J. Isolation and structure of bryostatin 1. J Am Chem Soc. 1982;104:6846–8.
    1. Kazanietz MG, Bustelo XR, Barbacid M, Kolch W, Mischak H, Wong G, et al. Zinc finger domains and phorbol ester pharmacophore. Analysis of binding to mutated form of protein kinase C zeta and the vav and c-raf proto-oncogene products. J Biol Chem. 1994 Apr 15;269(15):11590–4. - PubMed
    1. Hennings H, Blumberg PM, Pettit GR, Herald CL, Shores R, Yuspa SH. Bryostatin 1, an activator of protein kinase C, inhibits tumor promotion by phorbol esters in SENCAR mouse skin. Carcinogenesis. 1987 Sep;8(9):1343–6. - PubMed
    1. Newton AC. Protein Kinase C: Structure, Function, and Regulation. J Biol Chem. 1995 December 1;270(48):28495–8. - PubMed
    1. Szallasi Z, Du L, Levine R, Lewin N, Nguyen P, Williams M, et al. The bryostatins inhibit growth of B16/F10 melanoma cells in vitro through a protein kinase C-independent mechanism: dissociation of activities using 26-epi-bryostatin 1. Cancer Res. 1996 May 1;56(9):2105–11. - PubMed

Publication types

MeSH terms