. 2006 May;12(5):733-50.
doi: 10.1261/rna.2326106. Epub 2006 Mar 15.

A combined computational and microarray-based approach identifies novel microRNAs encoded by human gamma-herpesviruses

Affiliations

A combined computational and microarray-based approach identifies novel microRNAs encoded by human gamma-herpesviruses

Adam Grundhoff et al. RNA. 2006 May.

Abstract

We have developed an approach to identify microRNAs (miRNAs) that is based on bioinformatics and array-based technologies, without the use of cDNA cloning. The approach, designed for use on genomes of small size (<2 Mb), was tested on cells infected by either of two lymphotropic herpesviruses, KSHV and EBV. The viral genomes were scanned computationally for pre-miRNAs using an algorithm (VMir) we have developed. Candidate hairpins suggested by this analysis were then synthesized as oligonucleotides on microarrays, and the arrays were hybridized with small RNAs from infected cells. Candidate miRNAs that scored positive on the arrays were then subjected to confirmatory Northern blot analysis. Using this approach, 10 of the known KSHV pre-miRNAs were identified, as well as a novel pre-miRNA that had earlier escaped detection. This method also led to the identification of seven new EBV-encoded pre-miRNAs; by using additional computational approaches, we identified a total of 18 new EBV pre-miRNAs that produce 22 mature miRNA molecules, thereby more than quadrupling the total number of hitherto known EBV miRNAs. The advantages and limitations of the approach are discussed.


Figures
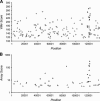
FIGURE 1.
FIGURE 1.
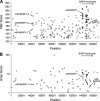
(A) VMir analysis of the KSHV genome; shown are all hairpins that fold in 35 or more windows and achieved a VMir score of 115 or above. Hairpins are plotted according to genomic location and VMir score. (B) Array analysis of potential KSHV-encoded pre-miRNAs. Only hairpins scoring under stringent conditions are shown, plotted according to position and the score achieved in the array analysis (see text for details). Positions indicated on the X-axis refer to the analyzed sequence that represents the complete long unique region of KSHV and was assembled from GenBank entries KSU86667, U93872, and KSU85269 (see Materials and Methods for details). (Squares) Hairpins in direct orientation; (triangles) hairpins in reverse orientation; (filled symbols) hairpins that scored in the array analysis (gray) and hairpins representing confirmed pre-miRNAs (black).
FIGURE 2.
FIGURE 2.
(A) VMir analysis of the EBV genome; shown are all hairpins that fold in 35 or more windows and achieved a VMir score of 115 or above. Hairpins are plotted according to genomic location and VMir score. (B) Array analysis of potential EBV-encoded pre-miRNAs. Only oligonucleotides with normalized ratios of 1 or above were considered in the array analysis, and only hairpins that scored under these conditions are shown, plotted according to position and the score achieved in the array analysis (see text for details). The five pre-microRNAs previously identified by Pfeffer et al. (2004) are marked (we did not attempt to confirm these miRNAs by Northern blotting). Positions given on the X-axis refer to the analyzed sequence representing the complete wild-type EBV genome (GenBank entry AJ507799). (Squares) Hairpins in direct orientation; (triangles) hairpins in reverse orientation; (filled symbols) hairpins that scored in the array analysis (gray) and hairpins representing confirmed pre-miRNAs (black).
FIGURE 3.
FIGURE 3.
Example of the array analysis for one of the confirmed KSHV pre-miRNAs (MR2892/miR-K12-4), using data of the 20-mer vs. 30-mer sample hybridized to the hairpin and tile arrays. The hairpin structure is indicated below its sequence by brackets (paired nucleotides) and dots (unpaired nucleotides), and regions constituting left and right arms as well as the terminal loop are indicated above. The names of oligonucleotides from the hairpin and tile arrays are shown to the left. The normalized ratios observed for arrays hybridized to the 20-mer vs. 30-mer sample are shown to the right of the oligonucleotide names. Dst. is shown instead of ratios for oligonucleotides that are >10 nt away from the terminal loop; these oligonucleotides were not considered for the analysis of MR2892.
FIGURE 4.
FIGURE 4.
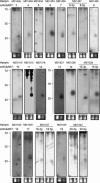
Northern Blot confirmation of KSHV miRNAs. Total RNA from KSHV-positive BCBL1 cells (right lanes in each blot) and KSHV-negative BJAB cells (left lanes in each blot) was probed with radioactively labeled oligonucleotides. Probes were selected based on the arrays analysis and correspond to the bold sequences in Figure 5. The names of the hairpins as detected by VMir are shown at the top, while names of the miRNAs are given below. No miRNA name was assigned to hairpin MR2079 since a weak signal (too faint to be seen in the figure) was observed in the BJAB lane (see text for details). The lower right blot served as a positive control and was probed for human miR-16. As a load control, an ethidium bromide stain of the low-molecular-weight RNA is shown under each blot. A ladder showing the approximate migration of oligonucleotides is shown to the left.
FIGURE 5.
FIGURE 5.
Predicted hairpin structures of confirmed KSHV pre-miRNAs and hairpin MR2079. Hairpins longer than 100 nt were truncated; these hairpins are indicated by a double slash preceding the stem. (In the context of 500-nt windows, MR2896/KSHV-miR-K12-1 was detected only as a short [51-nt] hairpin; sequences shown in lowercase represent an extension of the hairpin obtained after folding of a smaller [80-nt] window centered on the hairpin.) The positions of the sequences within the KSHV genome are shown in brackets; all positions are given according to GenBank entry U93872. The regions complementary to which the oligonucleotide Northern probes were designed are shown in bold. The positions of mature miRNAs that were cloned by other groups (Cai et al. 2005; Pfeffer et al. 2005; Samols et al. 2005) are marked by solid brackets; dotted brackets indicate suspected miRNA positions (see text for details).
FIGURE 6.
FIGURE 6.
Map of the KSHV genome between ORFs K12 and 73. Open reading frames and repeat regions are shown as black and as gray boxes, respectively. The positions of the KSHV-pre-miRNAs are indicated by black arrowheads. Several latently expressed mRNAs are shown below (Dittmer et al. 1998; Sadler et al. 1999; Li et al. 2002; Matsumura et al. 2005; Pearce et al. 2005). The question mark indicates a 2.3-kb “Kaposin” mRNA (Sadler et al. (1999); it is unclear to what extent this transcript contributes to the overall abundance of Kaposin-encompassing transcripts in latently infected cells.
FIGURE 7.
FIGURE 7.
Detailed depiction of VMir-predicted hairpins within the BART region of EBV. Only hairpins predicted in the same (i.e., forward) orientation as the BART transcripts are shown. (Black boxes) Pre-miRNA hairpins that were confirmed by Northern blotting in this study (we did not attempt Northern blots for the previously identified pre-miRNAs miR-BART1 and -2). (Gray boxes) Hairpins that achieved positive scores during the array analysis but were not confirmed as pre-miRNAs by Northern blotting. The prototypical RPMS1 transcript as described by Smith et al. (2000) is shown below. The region deleted in the B95-8 strain of EBV is indicated.
FIGURE 8.
FIGURE 8.
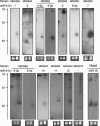
Northern Blot confirmation of EBV miRNAs. Total RNA from EBV-positive Jijoye cells (right lanes in each blot) and EBV-negative BJAB cells (left lanes in each blot) was probed with radioactively labeled oligonucleotides. Probes were selected based on the arrays analysis and correspond to the bold sequences in Figure 9. The names of the hairpins as detected by VMir are shown at the top, while names of the miRNAs are given below. As a load control, an ethidium bromide stain of the low-molecular-weight RNA is shown under each blot. A ladder showing the approximate migration of oligonucleotides is shown to the left.
FIGURE 9.
FIGURE 9.
Predicted hairpin structures of novel EBV pre-miRNAs. Hairpins longer than 100 nt were truncated; these hairpins are indicated by a double slash preceding the stem. The positions of the depicted sequences within the EBV genome are shown in brackets; all positions are given according to GenBank entry AJ507799. Regions complementary to which the oligonucleotide Northern probes were designed are shown in bold. The suspected positions of the mature miRNAs are indicated by dotted brackets.
FIGURE 10.
FIGURE 10.
Genomic map of the BART locus of EBV. Leftward open reading frames are shown as black boxes at the top. Black boxes below indicate the rightward open reading frame BARF0 as well as sequences coding for the RPMS1 and A73 proteins. The positions of EBV-pre-miRNAs are indicated by black arrowheads pointing right. (The previously identified pre-miR-BART1 and -2 [Pfeffer et al. 2004] are shown below the 18 novel pre-miRNAs identified in this study.) The various exons of the differentially spliced BART transcripts are shown as gray boxes and are labeled according to the study of Smith et al. (2000). Two alternatively spliced RPMS1-encoding transcripts identified in the same study are also shown.

Similar articles

Cited by

References

    1. AuCoin D.P., Colletti K.S., Cei S.A., Papouskova I., Tarrant M., Pari G.S. Amplification of the Kaposi's sarcoma-associated herpesvirus/human herpesvirus 8 lytic origin of DNA replication is dependent upon a cis-acting AT-rich region and an ORF50 response element and the trans-acting factors ORF50 (K-Rta) and K8 (K-bZIP) Virology. 2004;318:542–555. - PubMed
    1. Bagga S., Bracht J., Hunter S., Massirer K., Holtz J., Eachus R., Pasquinelli A.E. Regulation by let-7 and lin-4 miRNAs results in target mRNA degradation. Cell. 2005;122:553–563. - PubMed
    1. Barad O., Meiri E., Avniel A., Aharonov R., Barzilai A., Bentwich I., Einav U., Gilad S., Hurban P., Karov Y., et al. MicroRNA expression detected by oligonucleotide microarrays: System establishment and expression profiling in human tissues. Genome Res. 2004;14:2486–2494. - PMC - PubMed
    1. Bentwich I. Prediction and validation of microRNAs and their targets. FEBS Lett. 2005;579:5904–5910. - PubMed
    1. Bentwich I., Avniel A., Karov Y., Aharonov R., Gilad S., Barad O., Barzilai A., Einat P., Einav U., Meiri E., et al. Identification of hundreds of conserved and nonconserved human microRNAs. Nat. Genet. 2005;37:766–770. - PubMed

Publication types

MeSH terms

Grants and funding

LinkOut - more resources