Review
. 2006 Mar;70(1):253-82.
doi: 10.1128/MMBR.70.1.253-282.2006.

Glucose signaling in Saccharomyces cerevisiae

Affiliations
Review

Glucose signaling in Saccharomyces cerevisiae

George M Santangelo. Microbiol Mol Biol Rev. 2006 Mar.

Abstract

Eukaryotic cells possess an exquisitely interwoven and fine-tuned series of signal transduction mechanisms with which to sense and respond to the ubiquitous fermentable carbon source glucose. The budding yeast Saccharomyces cerevisiae has proven to be a fertile model system with which to identify glucose signaling factors, determine the relevant functional and physical interrelationships, and characterize the corresponding metabolic, transcriptomic, and proteomic readouts. The early events in glucose signaling appear to require both extracellular sensing by transmembrane proteins and intracellular sensing by G proteins. Intermediate steps involve cAMP-dependent stimulation of protein kinase A (PKA) as well as one or more redundant PKA-independent pathways. The final steps are mediated by a relatively small collection of transcriptional regulators that collaborate closely to maximize the cellular rates of energy generation and growth. Understanding the nuclear events in this process may necessitate the further elaboration of a new model for eukaryotic gene regulation, called "reverse recruitment." An essential feature of this idea is that fine-structure mapping of nuclear architecture will be required to understand the reception of regulatory signals that emanate from the plasma membrane and cytoplasm. Completion of this task should result in a much improved understanding of eukaryotic growth, differentiation, and carcinogenesis.


Figures
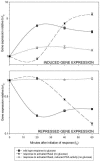
FIG. 1.
FIG. 1.
Wild-type versus Ras2 mimicry of the glucose response. Each curve represents the expression profile of genes exhibiting a twofold or greater change, both within 20 min of glucose addition and within 20 min of the appearance of activated Ras2. The average values for 250 such induced genes (upper graph) and repressed genes (lower graph) are shown (see supplemental data associated with reference 208); error bars represent standard errors of the means. Squares, expression profile of wild-type cells following glucose addition; filled triangles, expression profile of cells containing Gal-regulated Ras2* (activated Ras) following addition of galactose; open triangles, expression profile of cells containing Gal-regulated Ras2* (activated Ras) in a tpkw (weak PKA) background following addition of galactose. It is important to note that the >100-fold induction and repression observed for a small subset of glucose regulated genes (e.g., HXT genes; see reference 272) is not seen within the 60-minute time frame of this data set.
FIG. 2.
FIG. 2.
Cytoplasmic events in PKA signaling. Glucose regulation relies upon the intracellular signaling molecule (“second messenger”) cAMP. GTP-bound G proteins (Ras and Gpa2) bind independently to adenylate cyclase (Cyr1) and stimulate its production of cAMP. The monomeric Ras G proteins are anchored in the plasma membrane via a posttranslationally added palmitoyl moiety (red squiggle). RasGEFs (Cdc25 and Sdc25) and RasGAPs (Ira1 and Ira2) are also present in the Ras/Cyr1 complex and regulate adenylate cyclase by controlling the Ras switch (see text). The seven-transmembrane polypeptide Gpr1 acts upstream of Gpa2 in glucose signaling and is a member of the G protein-coupled receptor (GPCR) superfamily. Gpa2 was identified as a result of its similarity to the mammalian Gα subunits of heterotrimeric G proteins, and the putative Gβ subunits Gpb1 and Gpb2 were found via their interaction with Gpa2; a corresponding γ subunit has yet to be identified (question mark). A Gpa2GEF also awaits identification; Rgs2 is a known Gpa2GAP. Phosphodiesterases (Pde1 and Pde2) antagonize glucose signaling via enzymatic inactivation of cAMP (conversion to AMP). The PKA tetramer is the regulatory target of cAMP. While bound to the kinase subunits (TPK), the regulatory Bcy1 subunits keep PKA in an inactive state; cAMP activates the catalytic subunits by binding to Bcy1 subunits and promoting dissociation of the complex (dashed arrow).
FIG. 3.
FIG. 3.
The opposing roles of Reg1/Glc7 phosphatase and the Snf1 kinase complex. The duel between Reg1/Glc7 and Snf1/Snf4/Gal83 turns the Snf1 kinase on (ACTIVE) and off (INACTIVE) by determining whether the Snf1 regulatory domain (RD) binds to and autoinhibits its kinase domain (KD). This switch plays a central role in determining the transcriptomic response to the presence or absence of glucose. The β subunit Gal83 acts as a scaffolding factor for the nuclear form of the Snf1 (α) and Snf4 (γ) subunits of the kinase. Addition of glucose to yeast cells growing on an alternative carbon source results in the dephosphorylation of active Snf1 kinase by Reg1/Glc7 (no. 1); this returns Snf1 to the autoinhibited state (no. 2) and results in export of Snf1/Gal83 to the cytoplasm (not shown). Once glucose is depleted, Sak1 phosphorylates Snf1 (no. 3), Snf1/Gal83 enters the nucleus (not shown), and Snf4 binds to the Snf1 regulatory domain, thereby releasing the catalytic domain (no. 4); Reg1 then undergoes rapid Snf1-dependent phosphorylation (no. 6), which stabilizes the interaction between Snf1 and the Reg1/Glc7 phosphatase (no. 7) and primes the latter to repress Snf1 anew should glucose reappear. Std1 interacts with the Snf1 catalytic domain and stimulates kinase activity (no. 5), although it is stoichiometrically underrepresented in Snf1 complexes. A dynamic equilibrium (purple arrows between no. 6 and 7), in which Glc7 appears to counteract Snf1 phosphorylation of Reg1 and promote its own dissociation from active kinase complexes, is at the heart of this regulatory duel. Sip5 may stabilize the Reg1/Snf1 interaction in no. 6 (not shown). Hxk2 interacts with Reg1 (not shown), and Hxk2 may respond to PKA signaling by dimerizing and mediating the switch in Glc7 phosphatase substrate selection (from Reg1 [no. 7] to Snf1 [no. 1]; see the text).
FIG. 4.
FIG. 4.
The Snf3/Rgt2 signaling pathway. Transcription of hexose transporter genes (HXT) is repressed by Rgt1 in the absence of glucose; in contrast, Mig1 represses transcription of its target genes in the presence of glucose and cross-regulates the Snf3/Rgt2 pathway as shown. Relief from the repressor function of Rgt1 occurs via glucose signaling of the Snf3/Rgt2 sensors, which stimulate phosphorylation of Mth1 and Std1 by Yck kinases; the C-terminal tails of Snf3 and Rgt2 also appear to facilitate this event by interacting with both the kinases and their substrates. The Yck polypeptides are tethered to the plasma membrane via palmitate (red squiggles). Yck-phosphorylated Mth1 and Std1 are subjected to SCFGrr1-mediated ubiquitination and degradation by the proteasome. This releases Rgt1 from its upstream DNA binding sites and results in derepression of downstream HXT target genes. Removal of Mth1 and Std1 converts Rgt1 into a transcriptional activator that may stimulate HXT expression in the absence of specific DNA binding activity.
FIG. 5.
FIG. 5.
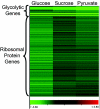
Transcriptomic analysis of defective gene expression in gcr1Δ cells. Microarray hybridization was done with RNA from isogenic gcr1Δ versus wild-type cultures grown to mid-logarithmic phase (a density of 1 × 10⁶ cells/ml) on each of the carbon sources indicated (2% glucose, 3% sucrose, or 3% pyruvate). Total RNA was extracted (408) and labeled with either Cy3-CTP or Cy5-CTP by using a low-RNA-input fluorescent linear amplification kit (Agilent Technologies, Palo Alto, CA). Labeled RNA was purified with the RNeasy MinElute kit (QIAGEN) and hybridized to yeast 60-mer oligonucleotide arrays (Agilent Technologies, Palo Alto, CA) according to the manufacturer's recommendations. Array slides were scanned at 10-μm resolution with two-line averaging by using an Axon GenePix 4200A scanner and GenePix 6.0 software. Hierarchical clustering was done with Acuity 4.0, with a centered Pearson similarity metric. The data shown here represent an average of two replicate arrays, including a dye-swap control. The scale shows color intensity proportional to the log ratio of expression in gcr1Δ cells (relative to the corresponding wild-type values). The cluster diagram shows the results for the 192 genes (11 glycolytic, 110 ribosomal protein, 4 translational component, and 67 other genes) that, in all three carbon sources, exhibit at least a twofold decrease in expression in gcr1Δ cells.
FIG. 6.
FIG. 6.
Both Gcr1 and Rpo21 are related to the RNA polymerase II large-subunit gene from M. invertens. The N terminus and carboxy-terminal domain (CTD) of Rpo21 exhibit strong homology with their M. invertens counterparts, whereas the internal region of the M. invertens protein exhibits weaker (although highly significant) homology with both Rpo21 and Gcr1. The transmembrane domains of Gcr1 (TM1 and TM2), as well as its primary homodimerization domain (1LZ), all of which make a critical contribution to Gcr1 function (see the text), exhibit >80% similarity with the M. invertens RNA polymerase large subunit, as indicated.
FIG. 7.
FIG. 7.
Perinuclear transcriptional activation of Rap1/Gcr1 target genes via reverse recruitment. Known components of the Rap1 activation (Gcr1/Gcr2) or silencing (Sir complex) assemblages are shown. Essential nucleoporins are indicated with an asterisk. Dashed lines highlight presumptive perinuclear tethering interactions; nuclear pore complex-associated factors shown to interact with Gcr1 are underlined. The representation shown here is not intended to rule out the existence of a unified complex that can switch between activation and repression of transcription. (Reprinted from reference with permission of the publisher. Copyright 2005 National Academy of Sciences, U.S.A.)
FIG. 8.
FIG. 8.
Perinuclear transcriptional activation of GAL genes via reverse recruitment. The glucose-regulated transcriptional activator Gal4 associates with its DNA binding sites whether the downstream target genes are inactive or active, as shown. The GAL1, GAL7, and GAL10 genes are not detectably associated with the nuclear periphery under conditions (in glucose-grown cells) in which their transcription is repressed (UNINDUCED, left side). When cells are grown in the presence of galactose, these same GAL genes associate with the nuclear periphery (INDUCED, right side).
FIG. 9.
FIG. 9.
A model for glucose regulation at the nuclear periphery of S. cerevisiae. Numerous regulators involved in the transcriptomic response to glucose are components of a large nuclear assemblage (gene expression machine) that is tethered to nuclear pores (dashed lines) via multiple interactions with the Nup84 subcomplex. Red arrows depict repressed target genes, and green arrows depict activated targets. Inactivation of DNA-bound regulators (Mig1, Mig3, and Nrg1) by the Snf1 kinase is predicted to involve a subtle conformational alteration that remains obscure. Many of these glucose regulatory factors, including components of the RNA polymerase II Mediator, are bifunctional factors that can either repress or activate transcription in a context-dependent fashion (shown here for Rap1). This facile switching between transcriptional readouts underscores the mechanistic subtlety of regulatory partnering and/or conformational specificity. Association between nuclear pores and the Gcr1/Gcr2 complex is required for transcriptional activation by both Rap1 and Nup84 subcomplex components (229). The perinuclear Rap1/Gcr1/Gcr2 assemblage thus allows productive access to GEMs by glucose-induced (glycolytic and RP) genes tethered at the nuclear periphery.

Similar articles

Cited by

References

    1. Ahn, J. H., S. H. Park, and H. S. Kang. 1995. Inactivation of the UAS1 of STA1 by glucose and STA10 and identification of two loci, SNS1 and MSS1, involved in STA10-dependent repression in Saccharomyces cerevisiae. Mol. Gen. Genet. 246:529-537. - PubMed
    1. Ahuatzi, D., P. Herrero, T. de la Cera, and F. Moreno. 2004. The glucose-regulated nuclear localization of hexokinase 2 in Saccharomyces cerevisiae is Mig1-dependent. J. Biol. Chem. 279:14440-14446. - PubMed
    1. Alberghina, L., R. L. Rossi, L. Querin, V. Wanke, and M. Vanoni. 2004. A cell sizer network involving Cln3 and Far1 controls entrance into S phase in the mitotic cycle of budding yeast. J. Cell Biol. 167:433-443. - PMC - PubMed
    1. Alms, G. R., P. Sanz, M. Carlson, and T. A. Haystead. 1999. Reg1p targets protein phosphatase 1 to dephosphorylate hexokinase II in Saccharomyces cerevisiae: characterizing the effects of a phosphatase subunit on the yeast proteome. EMBO J. 18:4157-4168. - PMC - PubMed
    1. Altschul, S. F., T. L. Madden, A. A. Schaffer, J. Zhang, Z. Zhang, W. Miller, and D. J. Lipman. 1997. Gapped BLAST and PSI-BLAST: a new generation of protein database search programs. Nucleic Acids Res. 25:3389-3402. - PMC - PubMed

Publication types

MeSH terms

LinkOut - more resources