. 2006 Mar 20;203(3):755-66.
doi: 10.1084/jem.20052165. Epub 2006 Mar 6.

T-bet regulates Th1 responses through essential effects on GATA-3 function rather than on IFNG gene acetylation and transcription

Affiliations

T-bet regulates Th1 responses through essential effects on GATA-3 function rather than on IFNG gene acetylation and transcription

Takashi Usui et al. J Exp Med. .

Erratum in

  • J Exp Med. 2006 Apr 17;203(4):1129

Abstract

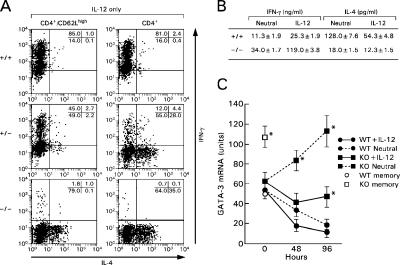
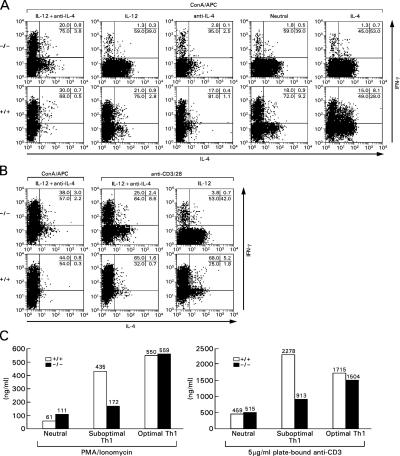
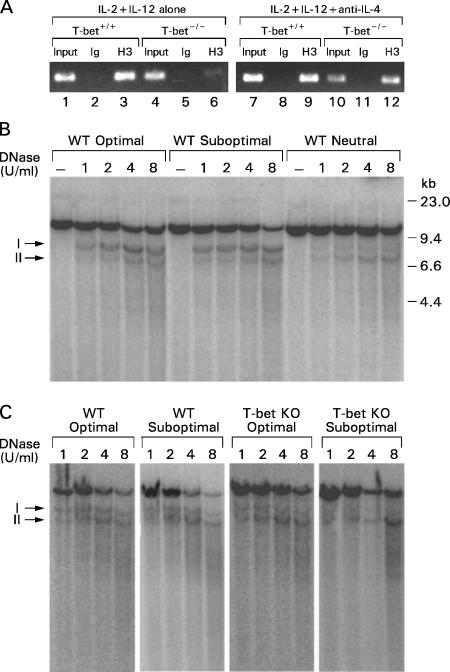
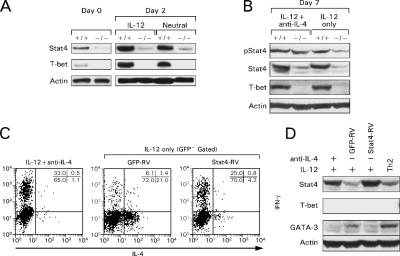
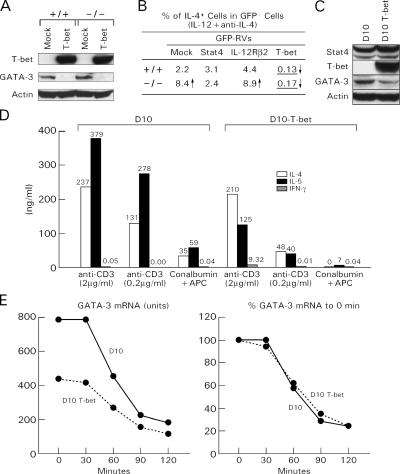
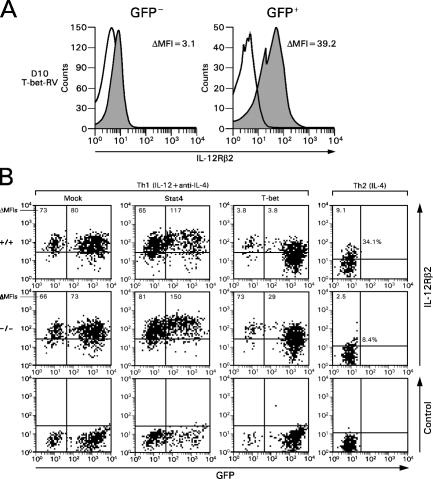
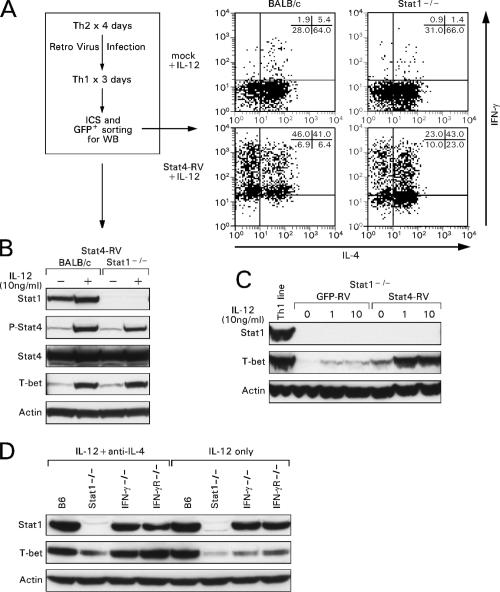
T helper type 1 (Th1) development is facilitated by interrelated changes in key intracellular factors, particularly signal transducer and activator of transcription (STAT)4, T-bet, and GATA-3. Here we show that CD4+ cells from T-bet-/- mice are skewed toward Th2 differentiation by high endogenous GATA-3 levels but exhibit virtually normal Th1 differentiation provided that GATA-3 levels are regulated at an early stage by anti-interleukin (IL)-4 blockade of IL-4 receptor (R) signaling. In addition, under these conditions, Th1 cells from T-bet-/- mice manifest IFNG promotor accessibility as detected by histone acetylation and deoxyribonuclease I hypersensitivity. In related studies, we show that the negative effect of GATA-3 on Th1 differentiation in T-bet-/- cells arises from its ability to suppress STAT4 levels, because if this is prevented by a STAT4-expressing retrovirus, normal Th1 differentiation is observed. Finally, we show that retroviral T-bet expression in developing and established Th2 cells leads to down-regulation of GATA-3 levels. These findings lead to a model of T cell differentiation that holds that naive T cells tend toward Th2 differentiation through induction of GATA-3 and subsequent down-regulation of STAT4/IL-12Rbeta2 chain unless GATA-3 levels or function is regulated by T-bet. Thus, the principal function of T-bet in developing Th1 cells is to negatively regulate GATA-3 rather than to positively regulate the IFNG gene.


Figures

Figure 1.
Figure 1.
Elevated IL-4 and GATA-3 and committed Th2 cells in T-bet−/− mice. (A) Naive CD4+ T cells and whole CD4+ T cells from T-bet−/−, T-bet+/+, and wild-type mice were stimulated with anti-CD3/anti-CD28 and maintained under Th1 conditions (IL-12 only) and expanded with IL-2. On day 6, the cells were subjected to intracellular cytokine staining after restimulation with PMA/ionomycin. These data are representative of results obtained from three independent experiments. (B) Naive CD4+ T cells from T-bet−/− and wild-type mice were stimulated with anti-CD3/anti-CD28 under Th1 conditions (IL-12 only) or neutral (no cytokines or antibodies added) conditions for 48 h, and then culture supernatants were harvested for IFN-γ and IL-4 determination by ELISA. The data shown are averages ± SE derived from three independent experiments. (C) Naive CD4+ T cells from T-bet−/− and wild-type mice were stimulated with anti-CD3/ anti-CD28 under Th1 conditions (IL-12 only) or neutral conditions and maintained for the time periods shown in the figure. At each time point, cells were harvested and total RNAs were isolated and subjected to real-time PCR analysis for GATA-3 mRNA quantification. Independently, total RNAs from freshly isolated naive and memory CD4+ T cells were prepared for day 9 samples. The data shown are averages ± SE derived from three independent experiments.
Figure 2.
Figure 2.
T-bet–independent Th1 development and IL-12Rβ2 chain expression. (A) Naive CD4+ T cells from T-bet−/− and wild-type mice (purified by flow cytometric sorting) were stimulated with Con A/APC (30 Gy-irradiated splenocytes from wild-type mice) under optimal Th1 conditions (IL-12 + anti–IL-4), suboptimal Th1 conditions (IL-12 only or anti–IL-4 only), neutral conditions, or suboptimal Th2 (IL-4 only) conditions. The cells were then expanded with IL-2 as well as cytokines and antibodies on days 2 and 4. On day 8, the cells were restimulated by PMA/ionomycin and subjected to intracellular cytokine staining for IL-4 and IFN-γ. See Materials and methods for further details. (B) Experimental design was the same as in A, except that cells subject to two kinds of stimulation (Con A/APC and anti-CD3/anti-CD28) were compared. These data are representative of results obtained from three independent experiments. (C) Naive CD4+ T cells from T-bet−/− and wild-type mice (purified by flow cytometric sorting) were stimulated with anti-CD3/anti-CD28 in the presence of IL-12 and 20 μg/ml anti–IL-4 (for optimal Th1 conditions) or with 5 ng/ml IL-12 (for suboptimal Th1 conditions). The cells were expanded by the addition of IL-2 on day 4 of culture and then washed and restimulated with PMA/ionomycin or plate-bound (pb) anti-CD3 on day 6, and culture supernatants were collected after 6 and 24 h, respectively, for assay of IFN-γ by ELISA (See Materials and methods).
Figure 3.
Figure 3.
T-bet−/− cells cultured under optimal Th1 conditions (in the presence of anti–IL-4) display normal IFNG promoter accessibility (histone acetylation). (A) Naive CD4+ T cells from T-bet+/+ and T-bet−/− mice were stimulated with anti-CD3/anti-CD28 under suboptimal (IL-12) or optimal (IL-12 plus anti–IL-4) Th1 conditions. After 3 d, the cells were subjected to ChIP assay as described in Materials and methods. Ig, isotype control H3, α-acetyl-histone 3. (B) DNase I hypersensitivity pattern of the IFNG locus of wild-type naive T cells stimulated with anti-CD3/anti-CD28 and cultured under optimal, suboptimal, or neutral conditions for 6 d. Hypersensitivity sites I and II are indicated by arrows. (C) Comparison of DNase I hypersensitivity patterns of the IFNG locus in wild-type and T-bet−/− naive CD4+ T cells cultured under optimal or optimal conditions for 6 d. Hypersensitivity sites I and II are indicated by arrows.
Figure 4.
Figure 4.
STAT4 signaling is impaired in T-bet−/− CD4+ T cells. (A) Naive CD4+ T cells from T-bet−/− and wild-type mice were stimulated with anti-CD3/anti-CD28 under either suboptimal Th1 conditions (IL-12 only) or neutral conditions. After maintenance for the time periods shown in the figure, whole cell lysates were subjected to Western blot analysis. Independently, lysates from freshly isolated naive CD4+ T cells were prepared for day 0 samples. Similar results were obtained in three other independent experiments. (B) Naive CD4+ T cells from T-bet−/− and wild-type mice were stimulated with anti-CD3/anti-CD28 under either optimal Th1 conditions (IL-12 + anti–IL-4) or suboptimal Th1 conditions (IL-12 only), and then expanded with IL-12 as well as cytokines and antibodies on days 2 and 4. On day 7, the cells were restimulated with fresh IL-12 for 30 min and lysed for Western blot analysis. Recombinant GATA-3 protein was prepared from GATA-3–expressing retrovirus-transfected Phoenix-Eco packaging cell line. Similar results were obtained in three other independent experiments. (C) Naive CD4+ T cells from T-bet−/− mice were stimulated and maintained as described in B. On day 2, the cells were infected with either control retrovirus (GFP-RV) or STAT4-expressing retrovirus (STAT4-RV). On day 7, the cells were restimulated by PMA/ionomycin and subjected to intracellular cytokine staining for IL-4 and IFN-γ. (D) The cells used in C were sorted by a flow cytometer according to GFP expression on day 6 and then lysed for Western blot analysis. The lysate of the Th2 line from T-bet−/− mice was also prepared as a positive control for GATA-3 protein. These data are representative of those obtained in three independent experiments.
Figure 5.
Figure 5.
T-bet overexpression suppresses GATA-3 and Th2 cytokines. (A) Naive CD4+ T cells from T-bet−/− and wild-type mice were stimulated with anti-CD3/anti-CD28 under strict Th2 conditions (IL-4 + anti–IFN-γ + anti–IL-12). On day 2, the cells were infected with control (mock) or T-bet–expressing retrovirus (T-bet-RV). Finally, on day 7, GFP+ cells were sorted by flow cytometry and lysed for Western blot studies. These data are representative of those obtained in three independent experiments. (B) Naive CD4+ T cells from T-bet−/− and wild-type mice were stimulated with anti-CD3/anti-CD28 under optimal Th1 conditions. On day 2, the cells were infected with control (mock) or STAT4-, IL-12Rβ2 chain–, or T-bet–expressing retroviruses. Finally, on day 7, cells were restimulated by PMA/ionomycin and subjected to intracellular cytokine staining for IL-4. The values shown were the percentages of IL-4+ cells in the GFP+ population. These data are representative of those obtained from two independent experiments. (C) An established murine Th2 cell line (D10 cells) was stimulated with conalbumin/APCs and then infected with a T-bet–expressing retrovirus on days 2, 3, 4, and 5. On day 14, GFP+ cells were enriched by flow cytometric sorting and restimulated with antigen/APC. Finally, on day 21, GFP+ and GFP cells were separated by sorting (purities were >92%) and lysed for Western blot analysis. (D) T-bet–expressing and nonexpressing D10 cells were obtained and cultured as described in C. On day 21, the cells were restimulated with either high (2 μg/ml) or low (0.2 μg/ml) concentrations of plate-bound anti-CD3 and/or conalbumin/APCs. 48 h after such restimulation, culture supernatants were collected and IL-4, IL-5, and IFN-γ were measured by ELISA. Similar results were obtained in three independent experiments. (E) T-bet–expressing and nonexpressing D10 cells were obtained and cultured as described in C. On day 21, 2 μg/ml actinomycin D was added to the cultures, and cells were harvested every 30 min for extraction of total RNA and subsequent real-time PCR analysis for GATA-3 mRNA. The left panel depicts the relative amount of GATA-3 mRNA normalized by 18S rRNA, and the right panel depicts the percent decreases from the nontreated sample. Similar results were obtained in two independent experiments.
Figure 6.
Figure 6.
T-bet is not a direct inducer of IL-12Rβ2 chain. (A) T-bet–expressing and nonexpressing D10 cells were obtained and cultured as described in Fig. 4 C and harvested for IL-12Rβ2 chain staining on day 21. The values shown in each panel depict the Δ mean fluorescence intensities (MFI)s for the IL-12Rβ2 chain stain after subtraction of the MFIs of a control stain. Open histograms depict isotype controls, and filled histograms depict IL-12Rβ2 chain–specific staining. (B) Naive CD4+ T cells from T-bet−/− and wild-type mice were stimulated with Con A/APCs under optimal Th1 (IL-12 + anti–IL-4) or Th2 conditions. On day 2, the cells were infected with control (mock), STAT4-, or T-bet–expressing retroviruses, and on day 5, surface IL-12Rβ2 chain staining was performed. The values shown in each panel represent the ΔMFIs of IL-12Rβ2 chain expression in either GFP or GFP+ populations after subtraction of the MFIs of control stainings.
Figure 7.
Figure 7.
STAT4 signal induces T-bet in the absence of STAT1. (A) Naive CD4+ T cells from BALB/c and STAT1−/− mice were stimulated with anti-CD3/anti-CD28 under Th2 conditions for 4 d. 24 h after stimulation, the cells were infected with mock-RV or STAT4-RV. On day 4, the cells were washed extensively and maintained under Th1 conditions (IL-12 and anti–IL-4 antibody) for another 3 d. Finally, the cells were restimulated by PMA/ionomycin and subjected to intracellular cytokine staining for IL-4 and IFN-γ. Similar results were obtained in three independent experiments. (B) The same cells used in A were initially cultured under Th2 conditions for 4 d and then either cultured under Th1 conditions or continued under Th2 conditions for 3 d. The cells were then sorted on day 7 according to GFP expression to obtain cells expressing STAT4-RV and then lysed for Western blot analysis. Similar results were obtained in three independent experiments. (C) The same cells used in A were initially cultured under Th2 conditions for 4 d and then either cultured under Th1 conditions with two concentrations of IL-12 or continued under Th2 conditions for 3 d. The cells were then sorted on day 7 according to GFP expression to obtain cells expressing STAT4-RV or GFP-RV (mock) and then lysed for Western blot analysis. Similar results were obtained in three independent experiments. (D) Naive CD4+ T cells from C57BL/6, STAT1−/−, IFN-γ−/−, and IFN-γR−/− mice were stimulated with anti-CD3/anti-CD28 either under strict Th1 conditions (IL-12 + anti–IL-4 antibody) or suboptimal Th1 conditions (IL-12 only) and expanded by hu-IL-2. On day 7, these cell lines were lysed and subjected to Western blot analysis. Similar results were obtained in two independent experiments.

Similar articles

Cited by

References

    1. Hsieh, C.S., S.E. Macatonia, C.S. Tripp, S.F. Wolf, A. O'Garra, and K.M. Murphy. 1993. Development of Th1 CD4+ T cells through IL-12 produced by Listeria-induced macrophages. Science. 260:547–549. - PubMed
    1. Jacobson, N.G., S.J. Szabo, R.M. Weber-Nordt, Z. Zhong, R.D. Schreiber, J.E. Darnell Jr., and K.M. Murphy. 1995. Interleukin 12 signaling in T helper type 1 (Th1) cells involves tyrosine phosphorylation of signal transducer and activator of transcription (STAT)3 and STAT 4. J. Exp. Med. 181:1755–1762. - PMC - PubMed
    1. Kaplan, M.H., Y.L. Sun, T. Hoey, and J.M. Grusby. 1996. Impaired IL-12 responses and enhanced development of Th2 cells in STAT4-deficient mice. Nature. 382:174–177. - PubMed
    1. Magram, J., S.E. Connaughton, R.R. Warrier, D.M. Carvajal, C.Y. Wu, J. Ferrante, C. Stewart, U. Sarmiento, D.A. Faherty, and M.K. Gately. 1996. IL-12-deficient mice are defective in IFN-γ production and type 1 cytokine responses. Immunity. 4:471–481. - PubMed
    1. Seder, R.A., R. Gazzinelli, A. Sher, and W.E. Paul. 1993. Interleukin 12 acts directly on CD4+ T cells to enhance priming for interferon gamma production and diminishes interleukin 4 inhibition of such priming. Proc. Natl. Acad. Sci. USA. 90:10188–10192. - PMC - PubMed

MeSH terms