Chondrocytes utilize a cholesterol-dependent lipid translocator to externalize phosphatidylserine
- PMID: 16519527
- PMCID: PMC4732727
- DOI: 10.1021/bi0515927
Chondrocytes utilize a cholesterol-dependent lipid translocator to externalize phosphatidylserine
Abstract
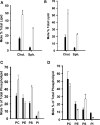
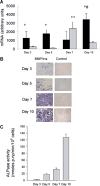
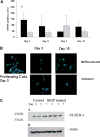
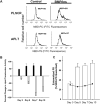
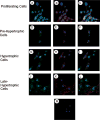
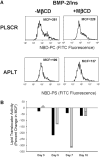
During endochondral ossification, growth plate chondrocytes release plasma membrane (PM) derived matrix vesicles (MV), which are the site of initial hydroxyapatite crystal formation. MV constituents which facilitate the mineralization process include the integral membrane ectoenzymes alkaline phosphatase (ALPase) and nucleotide pyrophosphatase phosphodiesterase (NPP1/PC-1), along with a phosphatidylserine- (PS-) rich membrane surface that binds annexins and calcium, resulting in enhanced calcium entry into MV. In this study, we determined that chick growth plate MV were highly enriched in membrane raft microdomains containing high levels of cholesterol, glycophosphatidylinositol- (GPI-) anchored ALPase, and phosphatidylserine (PS) localized to the external leaflet of the bilayer. To determine how such membrane microdomains arise during chondrocyte maturation, we explored the role of PM cholesterol-dependent lipid assemblies in regulating the activities of lipid translocators involved in the externalization of PS. We first isolated and determined the composition of detergent-resistant membranes (DRMs) from chondrocyte PM. DRMs isolated from chondrocyte PM were enhanced in ganglioside 1 (GM1) and cholesterol as well as GPI-anchored ALPase. Furthermore, these membrane domains were enriched in PS (localized to the external leaflet of the bilayer) and had significantly higher ALPase activity than non-cholesterol-enriched domains. To understand the role of cholesterol-dependent lipid assemblies in the externalization of PS, we measured the activities of two lipid transporters involved in PS externalization, aminophospholipid translocase (APLT) and phospholipid scramblase (PLSCR1), during maturation of a murine chondrocytic cell line, N1511. In this report, we provide the first evidence that maturing chondrocytes express PLSCR1 and have scramblase activity. We propose that redistribution of PS is dependent on an increase in phospholipid scramblase activity and a decrease in APLT activity. Lastly, we show that translocator activity is most likely to be modulated by membrane cholesterol levels through a membrane raft microdomain.
Figures
Similar articles
-
Engagement of phospholipid scramblase 1 in activated cells: implication for phosphatidylserine externalization and exocytosis.J Biol Chem. 2008 Apr 18;283(16):10904-18. doi: 10.1074/jbc.M710386200. Epub 2008 Feb 16. J Biol Chem. 2008. PMID: 18281686
-
Aminophospholipid translocase and phospholipid scramblase activities in sickle erythrocyte subpopulations.Br J Haematol. 2009 Aug;146(4):447-55. doi: 10.1111/j.1365-2141.2009.07760.x. Epub 2009 Jun 22. Br J Haematol. 2009. PMID: 19549270
-
Phosphatidylserine Lateral Organization Influences the Interaction of Influenza Virus Matrix Protein 1 with Lipid Membranes.J Virol. 2017 May 26;91(12):e00267-17. doi: 10.1128/JVI.00267-17. Print 2017 Jun 15. J Virol. 2017. PMID: 28356535 Free PMC article.
-
Phospholipid scramblase: an update.FEBS Lett. 2010 Jul 2;584(13):2724-30. doi: 10.1016/j.febslet.2010.03.020. Epub 2010 Mar 17. FEBS Lett. 2010. PMID: 20302864 Review.
-
Unraveling the mysteries of phospholipid scrambling.Thromb Haemost. 2001 Jul;86(1):266-75. Thromb Haemost. 2001. PMID: 11487015 Review.
Cited by
-
Role of matrix vesicles in biomineralization.Biochim Biophys Acta. 2009 Dec;1790(12):1592-8. doi: 10.1016/j.bbagen.2009.09.006. Epub 2009 Sep 26. Biochim Biophys Acta. 2009. PMID: 19786074 Free PMC article. Review.
-
TMEM16F is required for phosphatidylserine exposure and microparticle release in activated mouse platelets.Proc Natl Acad Sci U S A. 2015 Oct 13;112(41):12800-5. doi: 10.1073/pnas.1516594112. Epub 2015 Sep 28. Proc Natl Acad Sci U S A. 2015. PMID: 26417084 Free PMC article.
-
Physiologic and pathologic effects of dietary free fatty acids on cells of the joint.Ann N Y Acad Sci. 2019 Mar;1440(1):36-53. doi: 10.1111/nyas.13999. Epub 2019 Jan 15. Ann N Y Acad Sci. 2019. PMID: 30648276 Free PMC article. Review.
-
Proteoliposomes harboring alkaline phosphatase and nucleotide pyrophosphatase as matrix vesicle biomimetics.J Biol Chem. 2010 Mar 5;285(10):7598-609. doi: 10.1074/jbc.M109.079830. Epub 2010 Jan 4. J Biol Chem. 2010. PMID: 20048161 Free PMC article.
-
Lipid microenvironment affects the ability of proteoliposomes harboring TNAP to induce mineralization without nucleators.J Bone Miner Metab. 2019 Jul;37(4):607-613. doi: 10.1007/s00774-018-0962-8. Epub 2018 Oct 15. J Bone Miner Metab. 2019. PMID: 30324534 Free PMC article.
References
-
- Ballock RT, O’Keefe RJ. Physiology and pathophysiology of the growth plate. Birth Defects Res Part C. 2003;69:123. - PubMed
-
- Anderson HC. Mechanism of mineral formation in bone. Lab Invest. 1989;60:320. - PubMed
-
- Anderson HC. Matrix vesicles and calcification. Curr Rheumatol Rep. 2003;5:222. - PubMed
-
- Schwartz Z, Amir D, Weinberg H, Sela J. Extracellular matrix vesicle distribution in primary mineralization two weeks after injury to rat tibial bone (ultrastructural tissue morphometry) Eur J Cell Biol. 1987;45:97. - PubMed
-
- Harrison G, Shapiro IM, Golub EE. The phosphatidylinositol-glycolipid anchor on alkaline phosphatase facilitates mineralization initiation in vitro. J Bone Mineral Res. 1995;10:568. - PubMed
Publication types
MeSH terms
Substances
Grants and funding
- R01 EY010420-11/EY/NEI NIH HHS/United States
- R29 EY010420/EY/NEI NIH HHS/United States
- S10 RR026365/RR/NCRR NIH HHS/United States
- R01 DE013576/DE/NIDCR NIH HHS/United States
- R01 EY010420/EY/NEI NIH HHS/United States
- R01 EY010420-08/EY/NEI NIH HHS/United States
- R01 DE022465/DE/NIDCR NIH HHS/United States
- S10 RR026365-01/RR/NCRR NIH HHS/United States
- R01 EY010420-13A2/EY/NEI NIH HHS/United States
- R01 EY010420-10A2/EY/NEI NIH HHS/United States
- DE13576/DE/NIDCR NIH HHS/United States
- R01 EY010420-16/EY/NEI NIH HHS/United States
- R01 EY010420-09/EY/NEI NIH HHS/United States
- R21 EY018705-02/EY/NEI NIH HHS/United States
- R01 EY010420-07/EY/NEI NIH HHS/United States
- R29 EY010420-03/EY/NEI NIH HHS/United States
- R01 EY010420-06/EY/NEI NIH HHS/United States
- R01 EY010420-14/EY/NEI NIH HHS/United States
- R01 EY010420-12/EY/NEI NIH HHS/United States
- R01 EY010420-15/EY/NEI NIH HHS/United States
- R21 EY018705-01A1/EY/NEI NIH HHS/United States
- R21 EY018705/EY/NEI NIH HHS/United States
LinkOut - more resources
Full Text Sources
Medical
Miscellaneous

