. 2006 Feb 27;172(5):719-31.
doi: 10.1083/jcb.200510065.

Autophagy-mediated clearance of huntingtin aggregates triggered by the insulin-signaling pathway

Affiliations

Autophagy-mediated clearance of huntingtin aggregates triggered by the insulin-signaling pathway

Ai Yamamoto et al. J Cell Biol. .

Abstract

Conditional mouse models of polyglutamine diseases, such as Huntington's disease (HD), have revealed that cells can clear accumulated pathogenic proteins if the continuous production of the mutant transgene is halted. Invariably, the clearance of the protein leads to regression of the disease symptoms in mice. In light of these findings, it is critical to determine the pathway responsible for alleviating this protein accumulation to define targets to fight these diseases. In a functional genetic screen of HD, we found that activation of insulin receptor substrate-2, which mediates the signaling cascades of insulin and insulin-like growth factor 1, leads to a macroautophagy-mediated clearance of the accumulated proteins. The macroautophagy is triggered despite activation of Akt, mammalian target of rapamycin (mTOR), and S6 kinase, but still requires proteins previously implicated in macroautophagy, such as Beclin1 and hVps34. These findings indicate that the accumulation of mutant protein can lead to mTOR-independent macroautophagy and that lysosome-mediated degradation of accumulated protein differs from degradation under conditions of starvation.


Figures

Figure 1.
Figure 1.
Stable cell lines with conditional expression of exon1htt-polyQmCFP. (a) Representative images of stable cell lines with conditional expression of exon1htt with 25QmCFP, 65QmCFP, and 103QmCFP. (b) Cell lines clear polyQmCFP inclusions within 6 d upon abolishing protein expression. Data represented as mean ± SEM. n = 6.
Figure 2.
Figure 2.
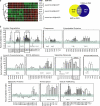
Two-tiered screen reveals genes that are required for the clearance of accumulated mutant exon1htt. (a) Gene profiling identifies transcriptional changes that are attributable to polyQ expression. Three Hum133A chips were run per polyQ length. For each chip, mRNA from independent clones was isolated to avoid clonal variability. Cluster and comparison analyses reveal that expression of pathogenic polyQ proteins leads to distinct transcriptional changes. The dendogram (left) is of the genes that differed from 25QmCFP samples. (b) siRNA gene knockdown reveals genes required for clearance of accumulated mutant exon1htt. Three to four siRNA sequences were designed and individually transfected into 65QmCFP or 103QmCFP HeLa cell lines. Each bar represents an individual siRNA. Cells were transfected for 48 h and then given 100 ng/ml dox for 2 d. The accumulation index is the data normalized to scramble siRNA-transfected cells treated with dox. 23 genes with an accumulation index greater than two standard deviations from control (designated by the gray box) were considered genes required for clearance. SiRNAs against 23 genes, including Lamp1, Lamp2, and IRS-2, lead to increased accumulation. Data represented as mean ± SD. Each siRNA was transfected in eight wells per experiment, and each experiment was repeated five to eight times, as described in Materials and methods.
Figure 3.
Figure 3.
IRS2 is required for clearance of mutant htt. (a) Representative images generated on the INCA 3000 of control (Ctrl; scramble + 2d dox), siRNA alone, and Dox + siIRS-2. (b) Quantification of percentage of control of the number of aggregates per cell for the three images. The presence of an effective siRNA against IRS-2 (si8H06) abolishes the clearance seen in the presence of dox. Complete quantitative results can be found in Fig 2.
Figure 4.
Figure 4.
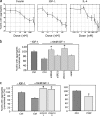
IRS-2 activation leads to clearance of accumulated mutant exon1htt. (a) Exon1htt-103QmCFP demonstrates a dose-dependent clearance of accumulated mutant protein after a 3-d treatment of insulin, IGF-1, and IL-4. Expression of the exon1htt-polyQmCFP was maintained throughout treatment. Exon1htt-65QmCFP clones exhibited similar effects (not depicted). (b) Two different siRNAs against hVps34 significantly inhibited clearance by IGF-1 (F(2,253) = 35.576; P < 0.0001) and insulin (not depicted). Direct application of 10 μM dipalmitoyl-PI3P liposomes for 3 d also led to fewer inclusion-positive cells (F(1,30) = 28.718; P < 0.0001). Data represented as mean ± SEM. Asterisks indicate statistical significance, as indicated. (c) Loss of IRS-2 (P = 0.0007) and a regulator of macroautophagy, Beclin1 (P < 0.0001), significantly inhibited IGF-1–mediated clearance. siRNA-mediated silencing of IRS1 (P = 0.3077) and Akt (P = 0.3792) had no effect (ANOVA revealed a significant effect of siRNA on percentage of control. F(5,186) = 4.907; P = 0.003). Data represented as mean ± SEM. Asterisks indicate statistical significance, as indicated.
Figure 5.
Figure 5.
Functional lysosomes are required for the clearance of mutant htt inclusions. (a) Clearance of exon1polyQhtt is inhibited in the presence of 1 μg/mL leupeptin (Leup), 100 nM bafilomycin A1 (Baf A1), 20 nM hydroxychloroquine (Chlor), 10 mM 3-methyladenine (3-MA), and 100 nM wortmannin (Wort). All compounds inhibited the clearance usually observed after 48 h dox, and thus are similar to No dox–treated cells (No dox). Data represented as mean ± SEM. (b) Costaining cells with 65 nM of Lysotracker reveals that inclusions colocalize with acidified compartments.
Figure 6.
Figure 6.
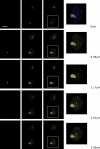
Exon1htt-polyQmCFP htt inclusions can be found engulfed by an LC3-positive vesicle. Z-sectioned image of an Exon1htt-65QmCFP cell cotransfected with eYFP-LC3. Bar, 100 μM.
Figure 7.
Figure 7.
IRS-2 activation leads to macroautophagy-mediated clearance of mutant htt inclusions. (a) Inclusions also colocalize with LC3-positive autophagosomes. Treatment with IGF-1 leads to an increase in the frequency of the colocalization of the mCFP-positive inclusions, whereas knockdown of Beclin1 eliminates this colocalization. (b) Quantification of the percentage of inclusions found in LC3-positive autophagosomes. Administration of IGF-1 leads to an increased frequency of colocalization versus control. P < 0.0001. Loss of Akt had no effect on this outcome. P = 0.0003. Loss of IRS-2 (P = 0.3232) and Beclin1 (P = 0.4281) eliminated this increase. (ANOVA revealed a significant effect of siRNA (F(3,24) = 4.183; P = 0.0161) and treatment (F(1,24) = 29.151; P < 0.0001) on the percentage of cells with LC3-positive inclusions. There was also a significant interaction between siRNA and treatment (F(3,24) = 6.524; P = 0.0022). Data represented as mean ± SEM. Asterisks indicate statistical significance, as indicated.
Figure 8.
Figure 8.
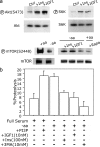
Macroautophagy caused by amino acid withdrawal is unchanged in mutant exon1htt-polyQ cell lines. (a) In the presence of mutant exon1htt expression, Akt and p70S6 kinase (S6K) are phosphorylated upon stimulation with IGF-1 and Ins for 30 min. In the presence of mutant exon1, mTOR is phosphorylated and decreases after amino acid withdrawal (-aa; 4 h) or 20 nM rapamycin (1 h). IGF-1 and Ins inhibit the effect of amino acid withdrawal. (b) [14C]valine-labeled long-lived protein degradation in response to 4 h amino acid withdrawal. ANOVA revealed a significant effect of treatment on the percentage of proteolysis (F(5,19) = 7.160; P = 0.0006). 10 μM PI3P-containing liposomes also increased proteolysis in the presence of full serum, as previously shown (P = 0.0010). 100 nM Ins (P = 0.8763) and 10 nM IGF-1 (P = 0.3999) inhibited the enhanced proteolysis caused by amino acid withdrawal (P = 0.0016), as did 10 mM 3-MA (P = 0.3074). Data represented as mean ± SEM.
Figure 9.
Figure 9.
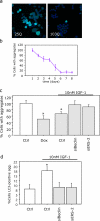
IRS-2 activation-mediated autophagy in a conditional neuronal cell line. (a) N2a stable cell lines inducibly expressing exon1htt-25QmCFP and -103QmCFP. Nuclei are stained with Hoechst 33342. (b) Clearance of accumulated protein occurred in 6 d. Data represented as mean ± SEM. (c) IRS-2 and Beclin 1 are required for IGF-1–mediated clearance. ANOVA revealed a significant effect across groups (F(4,43) = 5.793; P = 0.0008) Fisher's protected least significant difference test for “%Control” revealed a significant difference between control and dox-treated cells (P = 0.0006) and control and IGF-1–treated cells (P = 0.0179). Coadministration of siRNA against beclin1 (P = 0.9611) or IRS-2 (P = 0.4712) with IGF-1 eliminated clearance. Data represented as mean ± SEM. Asterisks indicate statistical significance, as indicated. (d) Quantification of the mCFP-positive inclusions found in LC3-positive autophagosomes. ANOVA revealed a significant effect across group (F(3,16) = 3.873; P = 0.0294). Fisher's protected least significant difference test for “% cells with LC3-positive inclusions” revealed a significant difference between control and IGF1 (P = 0.0097), but no difference with siIRS-2 (P = 0.7881) or siBeclin1 (P = 0.8372). Data represented as mean ± SEM. Asterisks indicate statistical significance, as indicated.
Figure 10.
Figure 10.
Working model of IRS-2-mediated activation of autophagy. IRS-2 activation leads to the formation of PI3P via hVps34. Beclin1 and hVps34 allow for the autophagosomes to form and engulf the aggregates. As other studies indicate (gray box) aggregate formation alone may trigger autophagy via a yet unknown pathway, but mTOR inhibition or p70S6 kinase activation (Scott et al., 2004) may play a role.

Similar articles

Cited by

References

    1. Andrejewski, N., E.L. Punnonen, G. Guhde, Y. Tanaka, R. Lullmann-Rauch, D. Hartmann, K. von Figura, and P. Saftig. 1999. Normal lysosomal morphology and function in LAMP-1-deficient mice. J. Biol. Chem. 274:12692–12701. - PubMed
    1. Arrasate, M., S. Mitra, E.S. Schweitzer, M.R. Segal, and S. Finkbeiner. 2004. Inclusion body formation reduces levels of mutant huntingtin and the risk of neuronal death. Nature. 431:805–810. - PubMed
    1. Backer, J.M. 2000. Phosphoinositide 3-kinases and the regulation of vesicular trafficking. Mol. Cell Biol. Res. Commun. 3:193–204. - PubMed
    1. Bence, N.F., R.M. Sampat, and R.R. Kopito. 2001. Impairment of the ubiquitin-proteasome system by protein aggregation. Science. 292:1552–1555. - PubMed
    1. Blommaart, E.F., U. Krause, J.P. Schellens, H. Vreeling-Sindelarova, and A.J. Meijer. 1997. The phosphatidylinositol 3-kinase inhibitors wortmannin and LY294002 inhibit autophagy in isolated rat hepatocytes. Eur. J. Biochem. 243:240–246. - PubMed

Publication types

MeSH terms