Naïve T-cell dynamics in human immunodeficiency virus type 1 infection: effects of highly active antiretroviral therapy provide insights into the mechanisms of naive T-cell depletion
- PMID: 16501076
- PMCID: PMC1395465
- DOI: 10.1128/JVI.80.6.2665-2674.2006
Naïve T-cell dynamics in human immunodeficiency virus type 1 infection: effects of highly active antiretroviral therapy provide insights into the mechanisms of naive T-cell depletion
Abstract
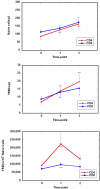
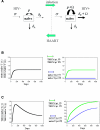
Both naïve CD4+ and naïve CD8+ T cells are depleted in individuals with human immunodeficiency virus type 1 (HIV-1) infection by unknown mechanisms. Analysis of their dynamics prior to and after highly active antiretroviral therapy (HAART) could reveal possible mechanisms of depletion. Twenty patients were evaluated with immunophenotyping, intracellular Ki67 staining, T-cell receptor excision circle (TREC) quantitation in sorted CD4 and CD8 cells, and thymic computed tomography scans prior to and approximately 6 and approximately 18 months after initiation of HAART. Naïve T-cell proliferation decreased significantly during the first 6 months of therapy (P < 0.01) followed by a slower decline. Thymic indices did not change significantly over time. At baseline, naïve CD4+ T-cell numbers were lower than naive CD8+ T-cell numbers; after HAART, a greater increase in naïve CD4+ T cells than naïve CD8+ T cells was observed. A greater relative change (n-fold) in the number of TREC+ T cells/mul than in naïve T-cell counts was observed at 6 months for both CD4+ (median relative change [n-fold] of 2.2 and 1.7, respectively; P < 0.01) and CD8+ T cell pools (1.4 and 1.2; P < 0.01). A more pronounced decrease in the proliferation than the disappearance rate of naïve T cells after HAART was observed in a second group of six HIV-1-infected patients studied by in vivo pulse labeling with bromodeoxyuridine. These observations are consistent with a mathematical model where the HIV-1-induced increase in proliferation of naïve T cells is mostly explained by a faster recruitment into memory cells.
Figures


Similar articles
-
Comparison of thymic function-related markers to predict early CD4 T-cell repopulation in adult HIV-infected patients on HAART.Antivir Ther. 2003 Aug;8(4):289-94. Antivir Ther. 2003. PMID: 14518697
-
HIV-1-infected children on HAART: immunologic features of three different levels of viral suppression.Cytometry B Clin Cytom. 2007 Jan 15;72(1):14-21. doi: 10.1002/cyto.b.20152. Cytometry B Clin Cytom. 2007. PMID: 17041945 Clinical Trial.
-
Association between larger thymic size and higher thymic output in human immunodeficiency virus-infected patients receiving highly active antiretroviral therapy.J Infect Dis. 2002 Jun 1;185(11):1578-85. doi: 10.1086/340418. Epub 2002 May 17. J Infect Dis. 2002. PMID: 12023763
-
Human immunodeficiency virus interactions with CD8+ T lymphocytes.Curr HIV Res. 2008 Jan;6(1):1-9. doi: 10.2174/157016208783572008. Curr HIV Res. 2008. PMID: 18288969 Review.
-
T cell regeneration in HIV-infected subjects under highly active antiretroviral therapy (review).Int J Mol Med. 1999 Jul;4(1):91-7. doi: 10.3892/ijmm.4.1.91. Int J Mol Med. 1999. PMID: 10373643 Review.
Cited by
-
Targeted Immuno-Antiretroviral to Promote Dual Protection against HIV: A Proof-of-Concept Study.Nanomaterials (Basel). 2022 Jun 6;12(11):1942. doi: 10.3390/nano12111942. Nanomaterials (Basel). 2022. PMID: 35683795 Free PMC article.
-
Modeling the immune response to HIV infection.Curr Opin Syst Biol. 2018 Dec;12:61-69. doi: 10.1016/j.coisb.2018.10.006. Epub 2018 Nov 8. Curr Opin Syst Biol. 2018. PMID: 31463420 Free PMC article.
-
A mechanistic model for long-term immunological outcomes in South African HIV-infected children and adults receiving ART.Elife. 2021 Jan 14;10:e42390. doi: 10.7554/eLife.42390. Elife. 2021. PMID: 33443013 Free PMC article.
-
Increased replication of CD4+ naive T cells and changes in T cell homeostasis in a case of acute exacerbation of juvenile idiopathic arthritis: a case comparison study.J Med Case Rep. 2013 May 21;7:135. doi: 10.1186/1752-1947-7-135. J Med Case Rep. 2013. PMID: 23692985 Free PMC article.
-
Accelerated aging and human immunodeficiency virus infection: emerging challenges of growing older in the era of successful antiretroviral therapy.J Neurovirol. 2012 Aug;18(4):247-55. doi: 10.1007/s13365-011-0073-y. Epub 2011 Dec 29. J Neurovirol. 2012. PMID: 22205585 Review.
References
-
- Arron, S. T., R. M. Ribeiro, A. Gettie, R. Bohm, J. Blanchard, J. Yu, A. S. Perelson, D. D. Ho, and L. Zhang. 2005. Impact of thymectomy on the peripheral T cell pool in rhesus macaques before and after infection with simian immunodeficiency virus. Eur. J. Immunol. 35:46-55. - PubMed
-
- Davey, R. T., Jr., N. Bhat, C. Yoder, T. W. Chun, J. A. Metcalf, R. Dewar, V. Natarajan, R. A. Lempicki, J. W. Adelsberger, K. D. Miller, J. A. Kovacs, M. A. Polis, R. E. Walker, J. Falloon, H. Masur, D. Gee, M. Baseler, D. S. Dimitrov, A. S. Fauci, and H. C. Lane. 1999. HIV-1 and T cell dynamics after interruption of highly active antiretroviral therapy (HAART) in patients with a history of sustained viral suppression. Proc. Natl. Acad. Sci. USA 96:15109-15114. - PMC - PubMed
-
- Davey, R. T., Jr., R. L. Murphy, F. M. Graziano, S. L. Boswell, A. T. Pavia, M. Cancio, J. P. Nadler, D. G. Chaitt, R. L. Dewar, D. K. Sahner, A. M. Duliege, W. B. Capra, W. P. Leong, M. A. Giedlin, H. C. Lane, and J. O. Kahn. 2000. Immunologic and virologic effects of subcutaneous interleukin 2 in combination with antiretroviral therapy: A randomized controlled trial. JAMA 284:183-189. - PubMed
-
- De Boer, R. J., H. Mohri, D. D. Ho, and A. S. Perelson. 2003. Turnover rates of B cells, T cells, and NK cells in simian immunodeficiency virus-infected and uninfected rhesus macaques. J. Immunol. 170:2479-2487. - PubMed
Publication types
MeSH terms
Substances
Grants and funding
LinkOut - more resources
Full Text Sources
Medical
Research Materials

