

Global and gene-specific analyses show distinct roles for Myod and Myog at a common set of promoters
- PMID: 16437161
- PMCID: PMC1383539
- DOI: 10.1038/sj.emboj.7600958
Global and gene-specific analyses show distinct roles for Myod and Myog at a common set of promoters
Abstract
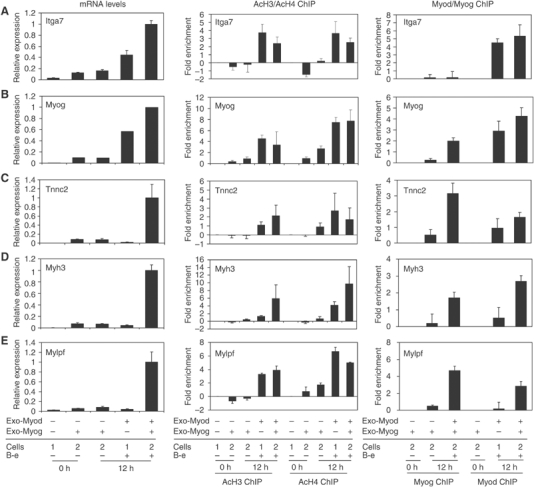
We used a combination of genome-wide and promoter-specific DNA binding and expression analyses to assess the functional roles of Myod and Myog in regulating the program of skeletal muscle gene expression. Our findings indicate that Myod and Myog have distinct regulatory roles at a similar set of target genes. At genes expressed throughout the program of myogenic differentiation, Myod can bind and recruit histone acetyltransferases. At early targets, Myod is sufficient for near full expression, whereas, at late expressed genes, Myod initiates regional histone modification but is not sufficient for gene expression. At these late genes, Myog does not bind efficiently without Myod; however, transcriptional activation requires the combined activity of Myod and Myog. Therefore, the role of Myog in mediating terminal differentiation is, in part, to enhance expression of a subset of genes previously initiated by Myod.
Figures
Similar articles
-
Effects of myogenin on expression of late muscle genes through MyoD-dependent chromatin remodeling ability of myogenin.Mol Cells. 2012 Aug;34(2):133-42. doi: 10.1007/s10059-012-2286-1. Epub 2012 Jul 18. Mol Cells. 2012. PMID: 22814845 Free PMC article.
-
Myomaker, Regulated by MYOD, MYOG and miR-140-3p, Promotes Chicken Myoblast Fusion.Int J Mol Sci. 2015 Nov 2;16(11):26186-201. doi: 10.3390/ijms161125946. Int J Mol Sci. 2015. PMID: 26540045 Free PMC article.
-
Myogenin is required for assembly of the transcription machinery on muscle genes during skeletal muscle differentiation.PLoS One. 2021 Jan 19;16(1):e0245618. doi: 10.1371/journal.pone.0245618. eCollection 2021. PLoS One. 2021. PMID: 33465133 Free PMC article.
-
Regulating a master regulator: establishing tissue-specific gene expression in skeletal muscle.Epigenetics. 2010 Nov-Dec;5(8):691-5. doi: 10.4161/epi.5.8.13045. Epub 2010 Nov 1. Epigenetics. 2010. PMID: 20716948 Free PMC article. Review.
-
Skeletal muscle programming and re-programming.Curr Opin Genet Dev. 2013 Oct;23(5):568-73. doi: 10.1016/j.gde.2013.05.002. Epub 2013 Jun 4. Curr Opin Genet Dev. 2013. PMID: 23756045 Free PMC article. Review.
Cited by
-
A systems approach and skeletal myogenesis.Comp Funct Genomics. 2012;2012:759407. doi: 10.1155/2012/759407. Epub 2012 Sep 6. Comp Funct Genomics. 2012. PMID: 22991503 Free PMC article.
-
The yeast Hot1 transcription factor is critical for activating a single target gene, STL1.Mol Biol Cell. 2015 Jun 15;26(12):2357-74. doi: 10.1091/mbc.E14-12-1626. Epub 2015 Apr 22. Mol Biol Cell. 2015. PMID: 25904326 Free PMC article.
-
MyoD inhibits Fstl1 and Utrn expression by inducing transcription of miR-206.J Cell Biol. 2006 Oct 9;175(1):77-85. doi: 10.1083/jcb.200603039. J Cell Biol. 2006. PMID: 17030984 Free PMC article.
-
Myogenin and class II HDACs control neurogenic muscle atrophy by inducing E3 ubiquitin ligases.Cell. 2010 Oct 1;143(1):35-45. doi: 10.1016/j.cell.2010.09.004. Cell. 2010. PMID: 20887891 Free PMC article.
-
MyoD synergizes with the E-protein HEB beta to induce myogenic differentiation.Mol Cell Biol. 2006 Aug;26(15):5771-83. doi: 10.1128/MCB.02404-05. Mol Cell Biol. 2006. PMID: 16847330 Free PMC article.
References
-
- Abramovich C, Shen WF, Pineault N, Imren S, Montpetit B, Largman C, Humphries RK (2000) Functional cloning and characterization of a novel nonhomeodomain protein that inhibits the binding of PBX1–HOX complexes to DNA. J Biol Chem 275: 26172–26177 - PubMed
-
- Bailey TL, Elkcan C (1994) Proceedings of the Second International Conference on Intelligent Systems for Molecular Biology. Menlo Park, CA: AAAI Press
-
- Banham AH, Connors JM, Brown PJ, Cordell JL, Ott G, Sreenivasan G, Farinha P, Horsman DE, Gascoyne RD (2005) Expression of the FOXP1 transcription factor is strongly associated with inferior survival in patients with diffuse large B-cell lymphoma. Clin Cancer Res 11: 1065–1072 - PubMed
-
- Benezra R, Davis RL, Lockshon D, Turner DL, Weintraub H (1990) The protein Id: a negative regulator of helix–loop–helix DNA binding proteins. Cell 61: 49–59 - PubMed
Publication types
MeSH terms
Substances
Grants and funding
LinkOut - more resources
Full Text Sources
Molecular Biology Databases
