Comparative Study
. 2006 Jan 18;26(3):731-41.
doi: 10.1523/JNEUROSCI.3502-05.2006.

Traumatic injury and the presence of antigen differentially contribute to T-cell recruitment in the CNS

Affiliations
Comparative Study

Traumatic injury and the presence of antigen differentially contribute to T-cell recruitment in the CNS

Changying Ling et al. J Neurosci. .

Abstract

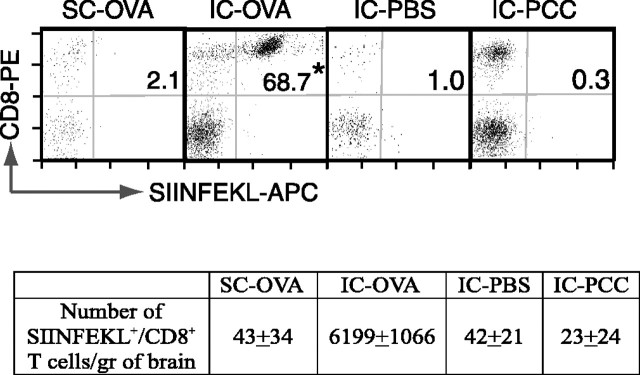
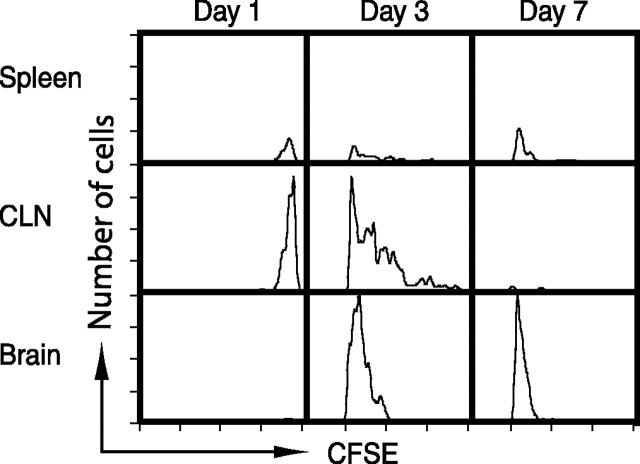
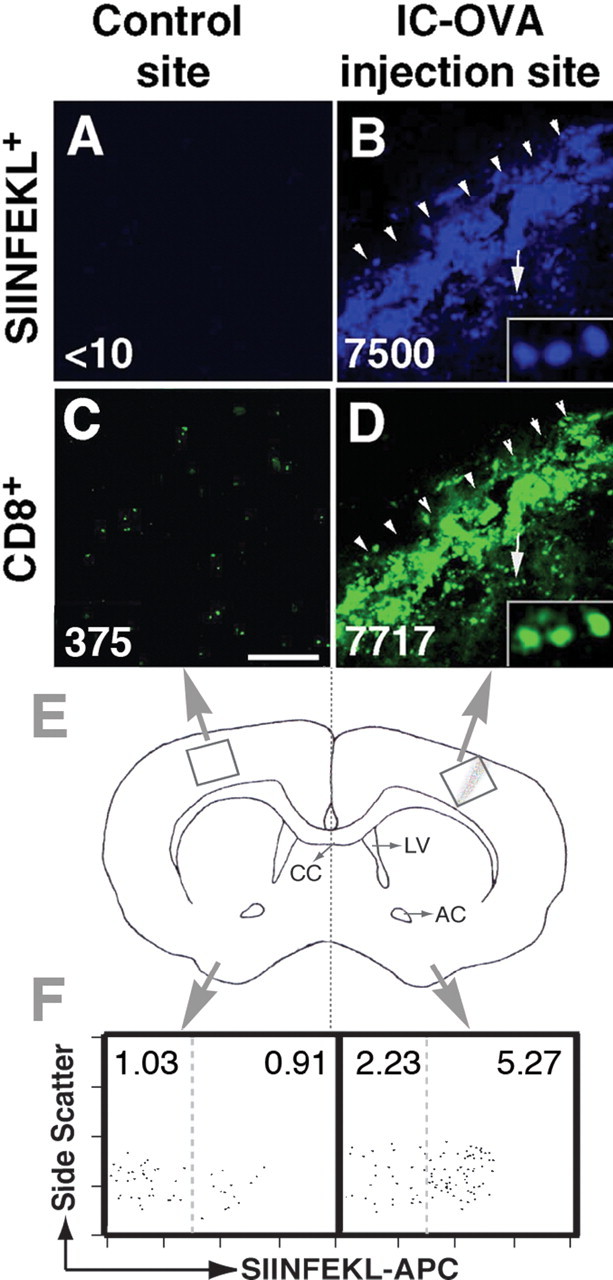
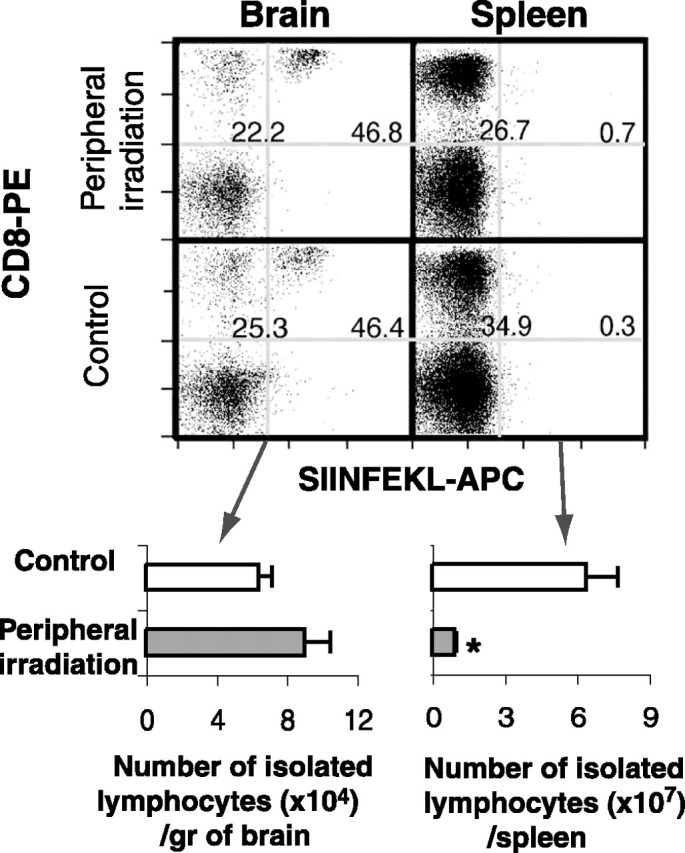
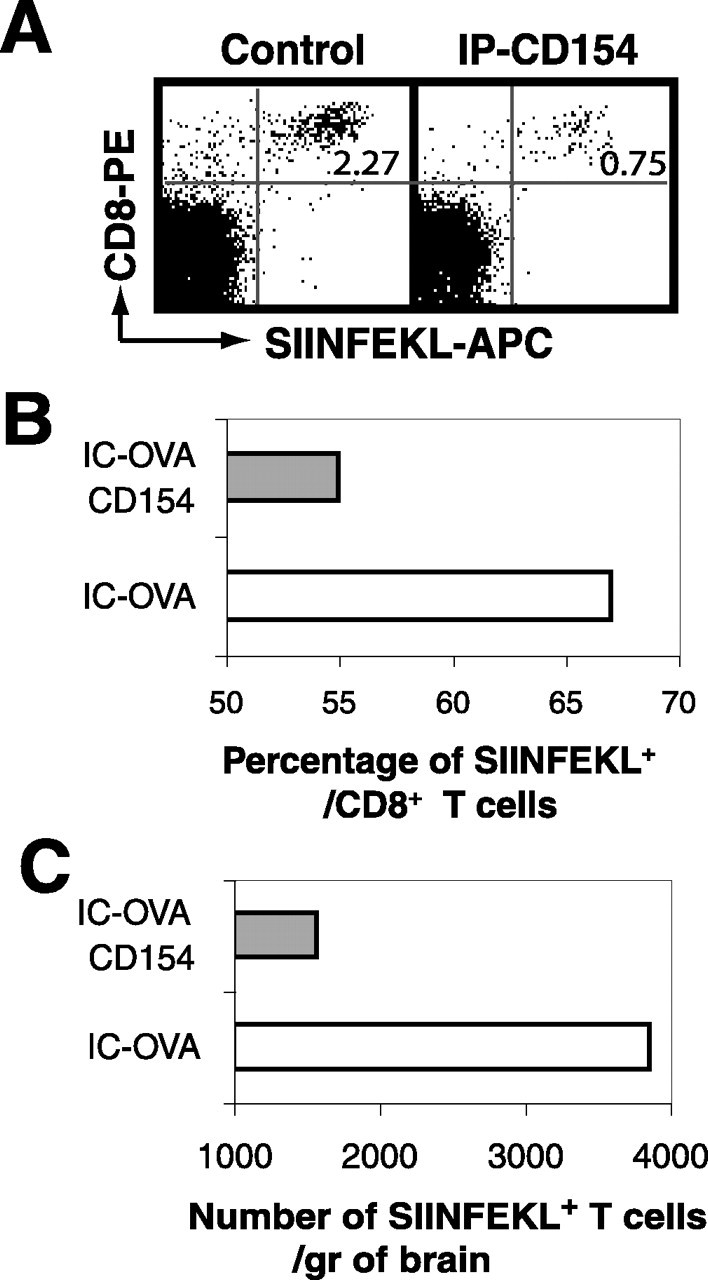
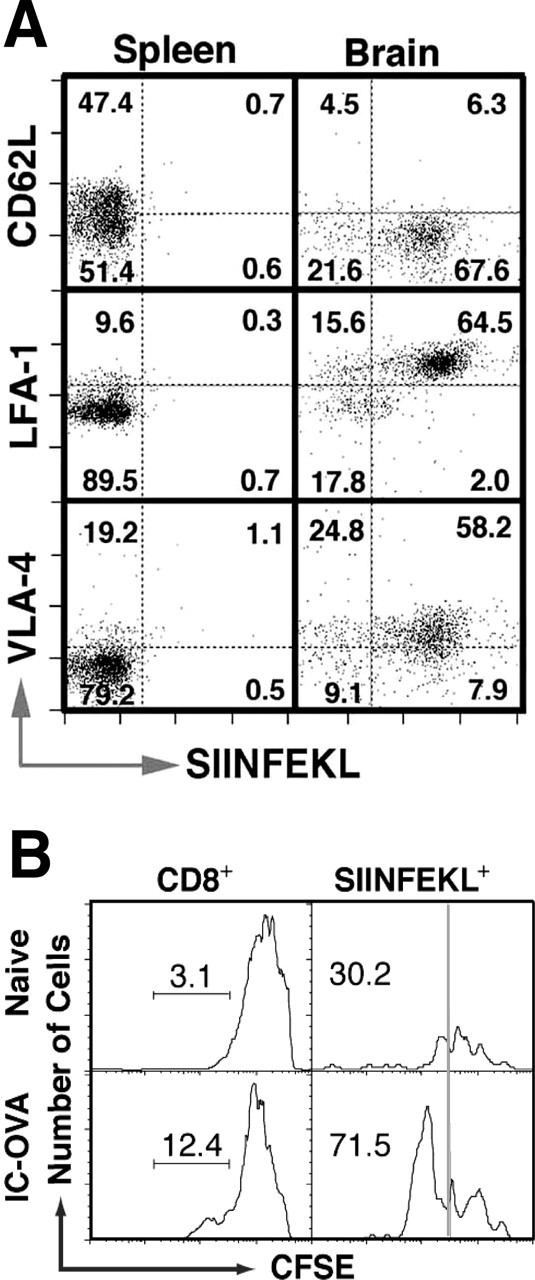
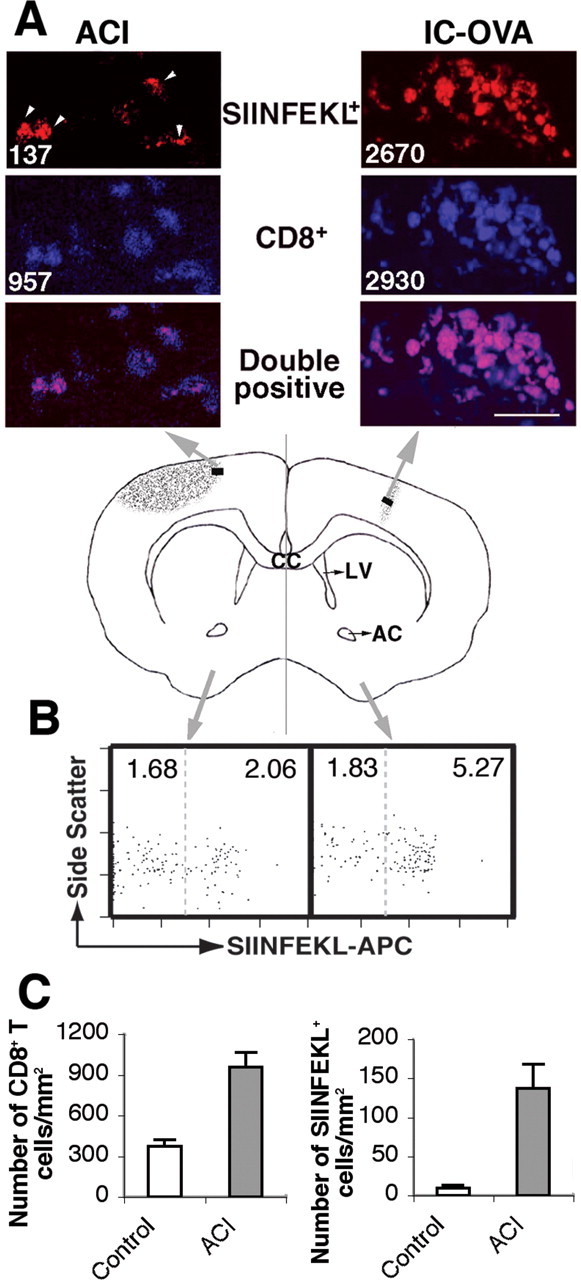
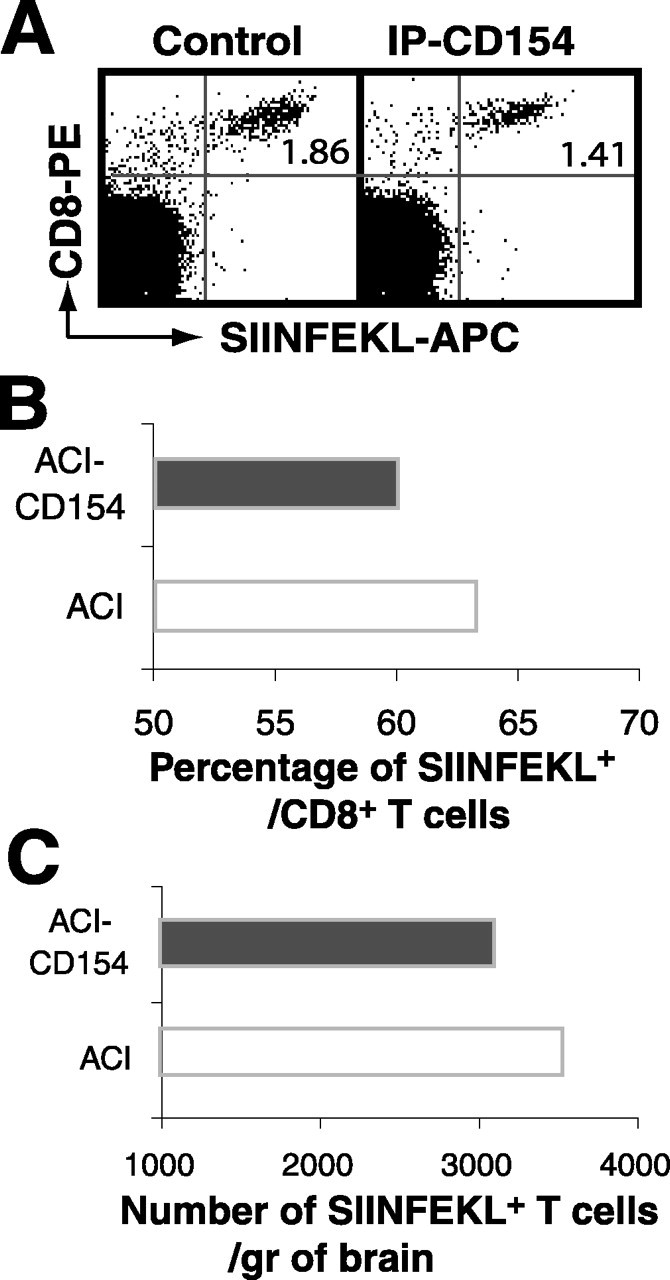
T-cell recruitment into the brain is critical in inflammatory and autoimmune diseases of the CNS. We use intracerebral antigen microinjection and tetramer technology to track antigen-specific CD8+ T-cells in the CNS and to clarify the contribution of antigen deposition or traumatic injury to the accumulation of T-cells in the brain. We demonstrate that, after intracerebral microinjection of ovalbumin, ovalbumin-specific CD8+ T-cells expand systemically and then migrate into the brain where they complete additional proliferation cycles. T-cells in the brain are activated and respond to in vitro secondary antigen challenge. CD8+ T-cells accumulate and persist in sites of antigen in the brain without replenishment from the periphery. Persistent survival of CD8+ T-cells at sites of cognate antigen is significantly reduced by blocking CD154 molecules. A small traumatic injury itself does not lead to recruitment of CD8+ T-cells into the brain but attracts activated antigen-specific CD8+ T-cells from cognate antigen injection sites. This process is presumably antigen independent and cannot be inhibited by blocking CD154 molecules. These data show that activated antigen-specific CD8+ T-cells accumulate in the CNS at both cognate antigen-containing and traumatic injury sites after intracerebral antigen delivery. The accumulation of activated antigen-specific T-cells at traumatic injury sites, in addition to antigen-containing areas, could amplify local inflammatory processes in the CNS. Combination therapies in neuroinflammatory diseases to block both of these processes should be considered.


Figures

Figure 1.
Figure 1.
Intracerebral immunization is necessary to induce the accumulation of protein antigen-specific CD8+ T-cells in brain. C57BL/6 mice received an IC or SC injection of OVA, PBS, or PCC on days 0 and 14 and were perfused on day 21. Brain lymphocytes were isolated and analyzed according to Materials and Methods. The dot plots are gated on CD45R/B220 and CD11b/Mac-1 viable lymphocytes. The value in each plot is the percentage of SIINFEKL+ cells within the CD8+ T-cell population. Data presented are representative analyses of two separate experiments, each with eight mice. The group mean number of SIINFEKL+ CD8+, CD45R/B220, and CD11b/Mac-1 T-cells per gram of brain tissue is also listed in the bottom table. *p < 0.001 in a t test.
Figure 2.
Figure 2.
Antigen-specific T-cells accumulate in the brain after completing multiple proliferation cycles in the periphery. C57BL/6 mice received an IC-OVA immunization 24 h after intravenous transfer of 1 × 10⁷ spleen cells isolated from naive OT-I mice and stained with CFSE as described in Materials and Methods. Lymphocytes were isolated from spleens, CLNs, and brains 1, 3, or 7 d after IC-OVA immunization and stained with Kb/SIINFEKL tetramers and antibodies to CD8. The histograms are gated on viable CD8+CFSE+SIINFEKL+ cells (adoptively transferred OT-I cells). Data presented are representative analyses from 12 mice in two independent experiments.a
Figure 3.
Figure 3.
Preferential localization of antigen-specific (MHC I-Kb/SIINFEKL-tetramer+) CD8+ T-cells in the brain parenchyma after a single IC-OVA injection. C57BL/6 mice were perfused 7 d after IC-OVA immunization. Free-floating brain sections and brain lymphocyte suspensions were prepared as described in Materials and Methods. A–D, Confocal images show the specific localization of SIINFEKL+ (blue) and CD8+ T-cells (green) in the brain. The value in each image is the mean number of labeled cells per square millimeter counted at high magnification (1000×) in a square region (96 × 96 μm) in the center of the injection track or contralateral tissue section. B, D, Insets are enlargements of cells indicated by arrows. OVA injection track (B, D) is indicated by arrowheads. E, Schematic diagram illustrates brain regions analyzed. F, Biased accumulation of OVA-specific CD8+ T-cells between two cerebral hemispheres. Brains were dissected from midline (E, dotted line), and lymphocytes were isolated from each half of the brain. The dot plots are gated on CD8+, CD45R/B220, and CD11b/Mac-1 viable lymphocytes. Values in each square are percentages of SIINFEKL negative (left) and positive (right) cells per total lymphocytes. Data are representative analyses for each group with at least six mice in two independent experiments. CC, Corpus callosum; AC, anterior commissure; LV, lateral ventricle. Scale bar, 250 μm.
Figure 4.
Figure 4.
Antigen-specific CD8+ T-cells persist in the brain without replenishment from the periphery. C57BL/6 mice received peripheral irradiation 7 d after IC-OVA immunization and were perfused 1 week later, as described in Materials and Methods. Lymphocytes isolated from brains and spleens were analyzed by flow cytometry. The dot plots are gated on CD45R/B220, CD11b/Mac-1 viable lymphocytes. The numbers in each plot represent the mean percentage of CD8+ cells within the B220, Mac-1-negative lymphocyte population (left) and the mean percentage of Kb/SIINFEKL+ cells within the CD8+ T-cell population (right), derived from six mice in two separate experiments. Histograms at the bottom show quantitative analyses of the total number of brain lymphocytes (left) and spleen lymphocytes (right) after peripheral irradiation. Bars represent the mean + SE number of CD8+ T-cells derived from six mice. *p < 0.01 in a t test.
Figure 5.
Figure 5.
Involvement of CD154 in the persistence of antigen-specific T-cells in the brain parenchyma. C57BL/6 mice received IC-OVA immunization and a single intraperitoneal treatment of anti-CD154 or isotype control antibody 7 d later, as described in Materials and Methods. Two days after anti-CD154 or control treatments, lymphocytes were isolated from the hemisphere that received IC-OVA immunization and pooled for each group. A, Dot plots are gated on viable lymphocytes and show that a single treatment of anti-CD154 antibodies significantly reduces the percentage and absolute number of OVA-specific (SIINFEKL+)/CD8+ cells. The number in each plot is the percentage of SIINFEKL+ CD8+ cells. B, C, Quantitative analysis of the percentage of SIINFEKL+ cells within the CD8+ T-cell population (B) and the total number of SIINFEKL+ CD8+ T-cells (C) in each side of the cerebral hemisphere after anti-CD154 treatment. Data presented are derived from 6 mice and comparable with the result derived from 10 mice with the same treatment, but with a different reagent to detect OVA-specific CD8+ T-cells in two other independent experiments.
Figure 6.
Figure 6.
Brain OVA-specific CD8+ T-cells express an activated phenotype and respond to recall antigen stimulation by proliferation. A, Phenotype of OVA-specific (SIINFEKL+) CD8+ T-cells isolated from spleens (left) and brains (right) of C57BL/6 mice 7 d after IC-OVA immunization. Dot plots are gated on viable CD8+ T-cells. For each plot, the quadrant percentage is indicated. B, Proliferation of brain OVA-specific CD8+ T-cells in response to OVA stimulation in vitro. Lymphocytes were isolated from brains of C57BL/6 mice with or without IC-OVA immunization, stained with CFSE, and incubated with OVA for 3 d, as described in Materials and Methods. Histograms are gated on viable CD8+ cells (left panels) or SIINFEKL+ cells (right panels). The number in each plot is the percentage of proliferating cells within an indicated population.
Figure 7.
Figure 7.
Antigen-specific CD8+ T-cells migrate to sterile traumatic injury sites in the brain. C57BL/6 mice received IC-OVA immunization on the right side of the cerebral cortex and an ACI on the left side 7 d later. Mice were perfused 2 d after ACI, and free-floating sections and lymphocyte suspensions were prepared from the brains, as described in Materials and Methods. A, Confocal images of brain sections show OVA-specific (SIINFEKL+; red) and CD8+ (blue) T-cells in the brain parenchyma. CD8+ T-cells, most of which are also SIINFEKL+, densely accumulate in the IC-OVA injection site (right panels). Comparatively fewer CD8+ T-cells are found in the ACI injury site (left panels), and only a portion of them are SIINFEKL+ (indicated by arrowheads). The value in each image is the number of labeled cells per square millimeter derived from the brain region (black rectangles) indicated in the schematic diagram of the middle panel. B, Flow cytometry analyses of brain lymphocytes. Lymphocytes were isolated from each half-brain and stained with Kb/SIINFEKL tetramers and antibodies to CD11b/Mac-1, CD45R/B220, and CD8. The plots are gated on CD8+, CD45R/B220, and CD11b/Mac-1 viable lymphocytes. Values in each square are percentages of SIINFEKL negative (left) and positive (right) cells per total lymphocytes. C, Effect of ACI on the infiltration of CD8+ T-cells in the hemisphere contralateral to IC-OVA immunization. Left panel, CD8+ T-cells; right panel, CD8+SIINFEKL+T-cells. Data presented are representative for each group, with six mice in two independent experiments. CC, Corpus callosum; AC, anterior commissure; LV, lateral ventricle. Scale bar, 25 μm.
Figure 8.
Figure 8.
Anti-CD154 antibody treatment does not significantly modify the accumulation of antigen-specific T-cells in traumatic injury sites. C57BL/6 mice received IC-OVA immunization on the right side of the cerebral cortex and an ACI on the left side 7 d later. Immediately after ACI, mice also received a single intraperitoneal treatment of anti-CD154 or isotype control antibodies as described in Materials and Methods. Two days after anti-CD154 or control treatments, lymphocytes were isolated from the hemisphere with ACI, pooled for each group, and analyzed. A, Dot plots are gated on viable lymphocytes, showing that a single treatment of anti-CD154 antibodies significantly reduces neither the percentage nor the absolute number of OVA-specific (SIINFEKL+)/CD8+ cells in the hemisphere with ACI. The number in each plot is the quadrant percentage for SIINFEKL+CD8+ cells. B, C, Quantitative analysis of the percentage of SIINFEKL+ cells within the CD8+ T-cell population (B) and the total number of SIINFEKL+ CD8+ T-cells (C) in the cerebral hemisphere after anti-CD154 treatment. Data presented are derived from six mice and are comparable with results derived from four mice with the same treatment, but with a different reagent to detect OVA-specific CD8+ T-cells in another independent experiment.

Similar articles

Cited by

References

    1. Aktas O, Smorodchenko A, Brocke S, Infante-Duarte C, Topphoff US, Vogt J, Prozorovski T, Meier S, Osmanova V, Pohl E, Bechmann I, Nitsch R, Zipp F (2005) Neuronal damage in autoimmune neuroinflammation mediated by the death ligand TRAIL. Neuron 46: 421–432. - PubMed
    1. Arand M, Melzner H, Kinzl L, Bruckner UB, Gebhard F (2001) Early inflammatory mediator response following isolated traumatic brain injury and other major trauma in humans. Langenbecks Arch Surg 386: 241–248. - PubMed
    1. Azukizawa H, Kosaka H, Sano S, Heath WR, Takahashi I, Gao XH, Sumikawa Y, Okabe M, Yoshikawa K, Itami S (2003) Induction of T-cell-mediated skin disease specific for antigen transgenically expressed in keratinocytes. Eur J Immunol 33: 1879–1888. - PubMed
    1. Babbe H, Roers A, Waisman A, Lassmann H, Goebels N, Hohlfeld R, Friese M, Schroder R, Deckert M, Schmidt S, Ravid R, Rajewsky K (2000) Clonal expansions of CD8(+) T cells dominate the T cell infiltrate in active multiple sclerosis lesions as shown by micromanipulation and single cell polymerase chain reaction. J Exp Med 192: 393–404. - PMC - PubMed
    1. Booss J, Esiri MM, Tourtellotte WW, Mason DY (1983) Immunohistological analysis of T lymphocyte subsets in the central nervous system in chronic progressive multiple sclerosis. J Neurol Sci 62: 219–232. - PubMed

Publication types