Processive movement of single kinesins on crowded microtubules visualized using quantum dots
- PMID: 16407972
- PMCID: PMC1383520
- DOI: 10.1038/sj.emboj.7600937
Processive movement of single kinesins on crowded microtubules visualized using quantum dots
Abstract
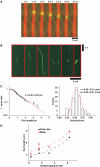
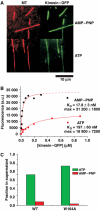
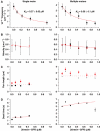
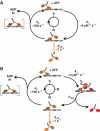
Kinesin-1 is a processive molecular motor transporting cargo along microtubules. Inside cells, several motors and microtubule-associated proteins compete for binding to microtubules. Therefore, the question arises how processive movement of kinesin-1 is affected by crowding on the microtubule. Here we use total internal reflection fluorescence microscopy to image in vitro the runs of single quantum dot-labelled kinesins on crowded microtubules under steady-state conditions and to measure the degree of crowding on a microtubule at steady-state. We find that the runs of kinesins are little affected by high kinesin densities on a microtubule. However, the presence of high densities of a mutant kinesin that is not able to step efficiently reduces the average speed of wild-type kinesin, while hardly changing its processivity. This indicates that kinesin waits in a strongly bound state on the microtubule when encountering an obstacle until the obstacle unbinds and frees the binding site for kinesin's next step. A simple kinetic model can explain quantitatively the behaviour of kinesin under both crowding conditions.
Figures


Similar articles
-
Motor transport of self-assembled cargos in crowded environments.Proc Natl Acad Sci U S A. 2012 Dec 18;109(51):20814-9. doi: 10.1073/pnas.1209304109. Epub 2012 Dec 3. Proc Natl Acad Sci U S A. 2012. PMID: 23213204 Free PMC article.
-
Obstacles on the microtubule reduce the processivity of Kinesin-1 in a minimal in vitro system and in cell extract.Biophys J. 2009 Apr 22;96(8):3341-53. doi: 10.1016/j.bpj.2009.01.015. Biophys J. 2009. PMID: 19383477 Free PMC article.
-
Multiple kinesins induce tension for smooth cargo transport.Elife. 2019 Oct 31;8:e50974. doi: 10.7554/eLife.50974. Elife. 2019. PMID: 31670658 Free PMC article.
-
Molecular motors: kinesin's interesting limp.Curr Biol. 2004 Feb 17;14(4):R158-9. Curr Biol. 2004. PMID: 15027469 Review.
-
Subunits interactions in kinesin motors.Eur J Cell Biol. 2007 Sep;86(9):559-68. doi: 10.1016/j.ejcb.2007.05.008. Epub 2007 Jul 12. Eur J Cell Biol. 2007. PMID: 17628208 Review.
Cited by
-
Microtubule Defects Influence Kinesin-Based Transport In Vitro.Biophys J. 2016 May 24;110(10):2229-40. doi: 10.1016/j.bpj.2016.04.029. Biophys J. 2016. PMID: 27224488 Free PMC article.
-
Motor transport of self-assembled cargos in crowded environments.Proc Natl Acad Sci U S A. 2012 Dec 18;109(51):20814-9. doi: 10.1073/pnas.1209304109. Epub 2012 Dec 3. Proc Natl Acad Sci U S A. 2012. PMID: 23213204 Free PMC article.
-
How the formation of amyloid plaques and neurofibrillary tangles may be related: a mathematical modelling study.Proc Math Phys Eng Sci. 2018 Feb;474(2210):20170777. doi: 10.1098/rspa.2017.0777. Epub 2018 Feb 7. Proc Math Phys Eng Sci. 2018. PMID: 29507520 Free PMC article.
-
Poleward transport of Eg5 by dynein-dynactin in Xenopus laevis egg extract spindles.J Cell Biol. 2008 Aug 25;182(4):715-26. doi: 10.1083/jcb.200801125. Epub 2008 Aug 18. J Cell Biol. 2008. PMID: 18710923 Free PMC article.
-
Stepping and crowding of molecular motors: statistical kinetics from an exclusion process perspective.Biophys J. 2014 Sep 2;107(5):1176-1184. doi: 10.1016/j.bpj.2014.07.012. Biophys J. 2014. PMID: 25185553 Free PMC article.
References
-
- Arnal I, Wade RH (1998) Nucleotide-dependent conformations of the kinesin dimer interacting with microtubules. Structure 6: 33–38 - PubMed
-
- Block SM, Goldstein LS, Schnapp BJ (1990) Bead movement by single kinesin molecules studied with optical tweezers. Nature 348: 348–352 - PubMed
-
- Castoldi M, Popov AV (2003) Purification of brain tubulin through two cycles of polymerization–depolymerization in a high-molarity buffer. Protein Expr Purif 32: 83–88 - PubMed
-
- Chan WC, Maxwell DJ, Gao X, Bailey RE, Han M, Nie S (2002) Luminescent quantum dots for multiplexed biological detection and imaging. Curr Opin Biotechnol 13: 40–46 - PubMed
Publication types
MeSH terms
Substances
LinkOut - more resources
Full Text Sources
Molecular Biology Databases

