. 2006 Mar 1;62(4):1010-25.
doi: 10.1002/prot.20817.

Multipass membrane protein structure prediction using Rosetta

Affiliations

Multipass membrane protein structure prediction using Rosetta

Vladimir Yarov-Yarovoy et al. Proteins. .

Abstract

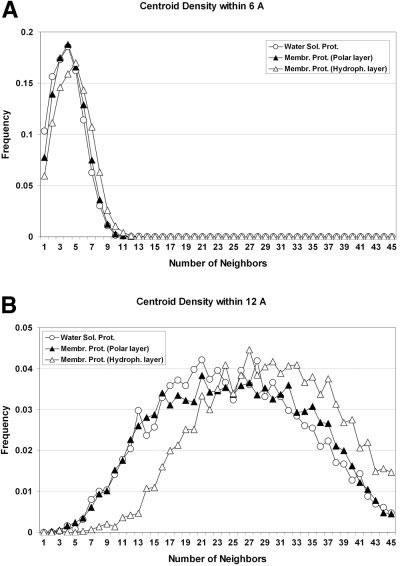
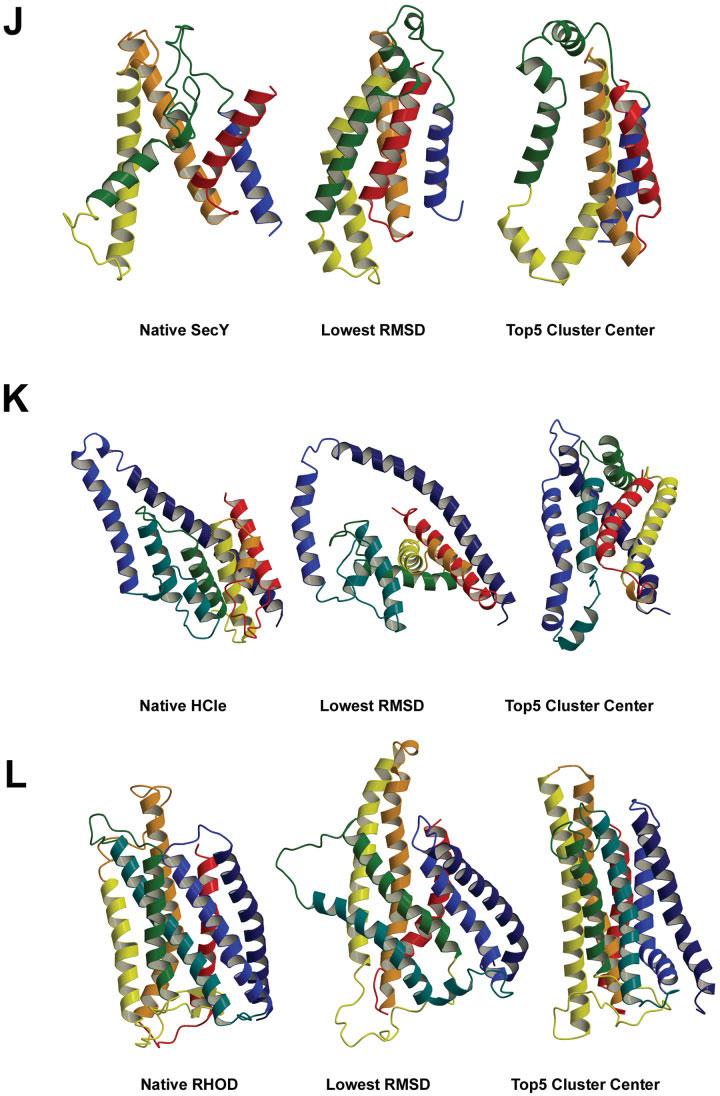
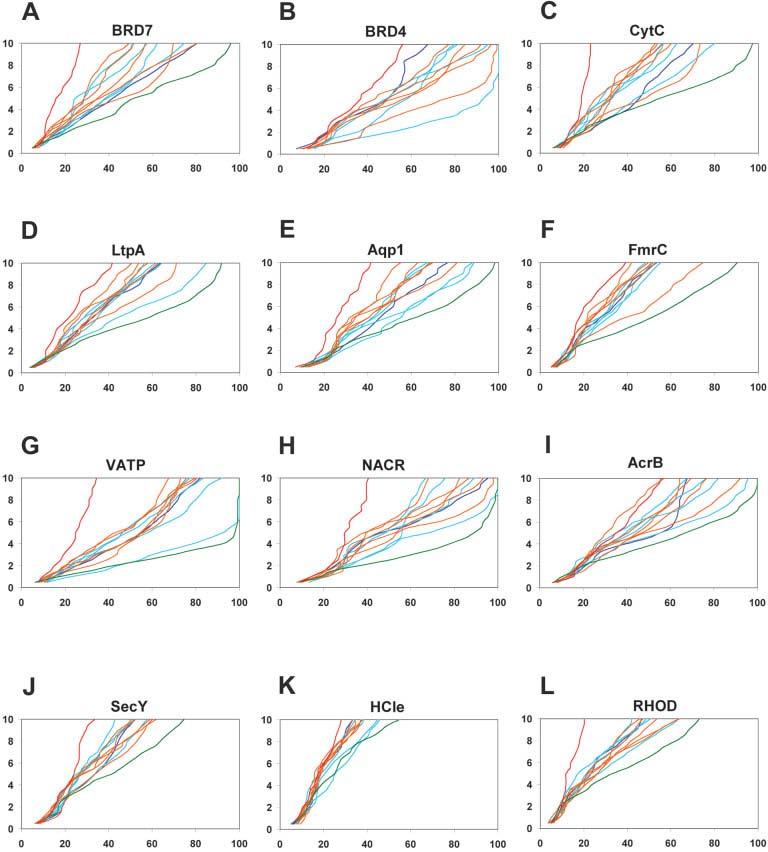
We describe the adaptation of the Rosetta de novo structure prediction method for prediction of helical transmembrane protein structures. The membrane environment is modeled by embedding the protein chain into a model membrane represented by parallel planes defining hydrophobic, interface, and polar membrane layers for each energy evaluation. The optimal embedding is determined by maximizing the exposure of surface hydrophobic residues within the membrane and minimizing hydrophobic exposure outside of the membrane. Protein conformations are built up using the Rosetta fragment assembly method and evaluated using a new membrane-specific version of the Rosetta low-resolution energy function in which residue-residue and residue-environment interactions are functions of the membrane layer in addition to amino acid identity, distance, and density. We find that lower energy and more native-like structures are achieved by sequential addition of helices to a growing chain, which may mimic some aspects of helical protein biogenesis after translocation, rather than folding the whole chain simultaneously as in the Rosetta soluble protein prediction method. In tests on 12 membrane proteins for which the structure is known, between 51 and 145 residues were predicted with root-mean-square deviation <4 A from the native structure.


Figures

Fig. 1
Fig. 1
Membrane layer definition. The lowest energy embedding of the fumarate reductase complex structure (PDB 1QLA) found using the method discussed in the text is colored as follows: “water-exposed” layer—dark blue; “polar” layer—light green; “interface” layer—green; “outer hydrophobic” layer—yellow; and “inner hydrophobic” layer—red.
Fig. 2
Fig. 2
Plots of membrane environmental score profiles for representative hydrophobic, small side-chain, aromatic, and polar amino acids. x Axis: the eight-residue burial states defined in Table II shown separately for each membrane layer (layer name labeled at the top of each plot). Number 9 on the plot indicates the number of neighbors between 0 and 9, number 12 indicates the number of neighbors between 10 and 12, etc. y Axis: Eenv. A: Plot of membrane environment score for leucine. B: Plot of membrane environment score for glycine. C: Plot of membrane environment score for tyrosine. D: Plot of membrane environment score for arginine.
Fig. 3
Fig. 3
Residue density profiles observed in the hydrophobic and polar layers of the membrane and α-helical type water-soluble proteins.
Fig. 4
Fig. 4
The best RMSD model and one of top five cluster center models compared with the native structure for each tested membrane protein. A: 7 TM helix bacteriorhodopsin (BRD7). B: 4 TM helix bacteriorhodopsin (BRD4). C: 5 TM helix subdomain of cytochrome C oxidase (CytC). D: 6 TM helix subdomain of lactose permease transporter (LtpA). E: 3 TM helix subdomain of aquaporin water channel (Aqp1). F: 5 TM helix subdomain of fumarate reductase complex (FmrC). G: 4 TM helix subdomain of V-type Na+-ATPase (VATP). H: 3 TM helix subdomain of nicotinic acetylcholine receptor (NACR). I: 5 TM helix subdomain of multidrug efflux transporter (AcrB). J: 5 TM helix subdomain of SecYEβ protein-conducting channel (SecY). K: 7 TM helix subdomain of H+/Cl exchange transporter (HCle). L: 7 TM helix rhodopsin (RHOD).
Fig. 4
Fig. 4
The best RMSD model and one of top five cluster center models compared with the native structure for each tested membrane protein. A: 7 TM helix bacteriorhodopsin (BRD7). B: 4 TM helix bacteriorhodopsin (BRD4). C: 5 TM helix subdomain of cytochrome C oxidase (CytC). D: 6 TM helix subdomain of lactose permease transporter (LtpA). E: 3 TM helix subdomain of aquaporin water channel (Aqp1). F: 5 TM helix subdomain of fumarate reductase complex (FmrC). G: 4 TM helix subdomain of V-type Na+-ATPase (VATP). H: 3 TM helix subdomain of nicotinic acetylcholine receptor (NACR). I: 5 TM helix subdomain of multidrug efflux transporter (AcrB). J: 5 TM helix subdomain of SecYEβ protein-conducting channel (SecY). K: 7 TM helix subdomain of H+/Cl exchange transporter (HCle). L: 7 TM helix rhodopsin (RHOD).
Fig. 5
Fig. 5
Global distance test (GDT47) plots for all membrane proteins tested. The y axis represents a Cα distance cutoff (in Angstroms) under which the model was fitted to the native structure, and the x axis represents the percentage of Cα atoms in the model that fit below that distance cutoff value. Dark blue—the largest cluster center, cyan—cluster centers 2–5, orange—cluster centers 6–10, green—best RMSD model, and red—worst RMSD model. A: 7 TM helix bacteriorhodopsin (BRD7). B: 4 TM helix bacteriorhodopsin (BRD4). Cluster center model 2 for BRD4 is also the best RMSD model and shown in cyan. C: 5 TM helix subdomain of cytochrome C oxidase (CytC). D: 6 TM helix subdomain of lactose permease transporter (LtpA). E: 3 TM helix subdomain of aquaporin water channel (Aqp1). F: 5 TM helix subdomain of fumarate reductase complex (FmrC). G: 4 TM helix subdomain of V-type Na+-ATPase (VATP). H: 3 TM helix subdomain of nicotinic acetylcholine receptor (NACR). I: 5 TM helix subdomain of multidrug efflux transporter (AcrB). J: 5 TM helix subdomain of SecYEβ protein-conducting channel (SecY). K: 7 TM helix subdomain of H_/Cl exchange transporter (HCle). L: 7 TM helix rhodopsin (RHOD).

Similar articles

Cited by

References

    1. Hopkins AL, Groom CR. The druggable genome. Nat Rev Drug Discov. 2002;1(9):727–730. - PubMed
    1. Wallin E, von Heijne G. Genome-wide analysis of integral membrane proteins from eubacterial, archaean, and eukaryotic organisms. Protein Sci. 1998;7(4):1029–1038. - PMC - PubMed
    1. Arkin IT, Brunger AT, Engelman DM. Are there dominant membrane protein families with a given number of helices? Proteins. 1997;28(4):465–466. - PubMed
    1. Liu J, Rost B. Comparing function and structure between entire proteomes. Protein Sci. 2001;10(10):1970–1979. - PMC - PubMed
    1. White SH. http://blanco.biomol.uci.edu/Membrane_Proteins_xtal.html http://blanco.biomol.uci.edu/Membrane_Proteins_xtal.html

Publication types

LinkOut - more resources