Synapsin-regulated synaptic transmission from readily releasable synaptic vesicles in excitatory hippocampal synapses in mice
- PMID: 16322053
- PMCID: PMC1805647
- DOI: 10.1113/jphysiol.2005.100685
Synapsin-regulated synaptic transmission from readily releasable synaptic vesicles in excitatory hippocampal synapses in mice
Abstract
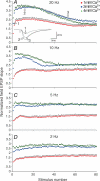
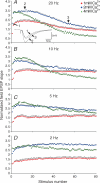
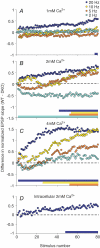
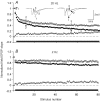
The effects of synapsin proteins on synaptic transmission from vesicles in the readily releasable vesicle pool have been examined by comparing excitatory synaptic transmission in hippocampal slices from mice devoid of synapsins I and II and from wild-type control animals. Application of stimulus trains at variable frequencies to the CA3-to-CA1 pyramidal cell synapse suggested that, in both genotypes, synaptic responses obtained within 2 s stimulation originated from readily releasable vesicles. Detailed analysis of the responses during this period indicated that stimulus trains at 2-20 Hz enhanced all early synaptic responses in the CA3-to-CA1 pyramidal cell synapse, but depressed all early responses in the medial perforant path-to-granule cell synapse. The synapsin-dependent part of these responses, i.e. the difference between the results obtained in the transgene and the wild-type preparations, showed that in the former synapse, the presence of synapsins I and II minimized the early responses at 2 Hz, but enhanced the early responses at 20 Hz, while in the latter synapse, the presence of synapsins I and II enhanced all responses at both stimulation frequencies. The results indicate that synapsins I and II are necessary for full expression of both enhancing and decreasing modulatory effects on synaptic transmission originating from the readily releasable vesicles in these excitatory synapses.
Figures


Similar articles
-
Isoproterenol increases the phosphorylation of the synapsins and increases synaptic transmission in dentate gyrus, but not in area CA1, of the hippocampus.Hippocampus. 1992 Jan;2(1):59-64. doi: 10.1002/hipo.450020108. Hippocampus. 1992. PMID: 1339193
-
Synapsin-dependent reserve pool of synaptic vesicles supports replenishment of the readily releasable pool under intense synaptic transmission.Eur J Neurosci. 2012 Oct;36(8):3005-20. doi: 10.1111/j.1460-9568.2012.08225.x. Epub 2012 Jul 17. Eur J Neurosci. 2012. PMID: 22805168
-
Synapsins regulate use-dependent synaptic plasticity in the calyx of Held by a Ca2+/calmodulin-dependent pathway.Proc Natl Acad Sci U S A. 2006 Feb 21;103(8):2880-5. doi: 10.1073/pnas.0511300103. Epub 2006 Feb 15. Proc Natl Acad Sci U S A. 2006. PMID: 16481620 Free PMC article.
-
The morphology of excitatory central synapses: from structure to function.Cell Tissue Res. 2006 Nov;326(2):221-37. doi: 10.1007/s00441-006-0288-z. Epub 2006 Aug 24. Cell Tissue Res. 2006. PMID: 16932936 Review.
-
Synapsins as regulators of neurotransmitter release.Philos Trans R Soc Lond B Biol Sci. 1999 Feb 28;354(1381):269-79. doi: 10.1098/rstb.1999.0378. Philos Trans R Soc Lond B Biol Sci. 1999. PMID: 10212475 Free PMC article. Review.
Cited by
-
Docosahexaenoic acid promotes hippocampal neuronal development and synaptic function.J Neurochem. 2009 Oct;111(2):510-21. doi: 10.1111/j.1471-4159.2009.06335.x. Epub 2009 Aug 13. J Neurochem. 2009. PMID: 19682204 Free PMC article.
-
Lack of synapsin I reduces the readily releasable pool of synaptic vesicles at central inhibitory synapses.J Neurosci. 2007 Dec 5;27(49):13520-31. doi: 10.1523/JNEUROSCI.3151-07.2007. J Neurosci. 2007. PMID: 18057210 Free PMC article.
-
A delayed response enhancement during hippocampal presynaptic plasticity in mice.J Physiol. 2007 Aug 15;583(Pt 1):129-43. doi: 10.1113/jphysiol.2007.131300. Epub 2007 Jun 14. J Physiol. 2007. PMID: 17569738 Free PMC article.
-
Synapsin- and actin-dependent frequency enhancement in mouse hippocampal mossy fiber synapses.Cereb Cortex. 2009 Mar;19(3):511-23. doi: 10.1093/cercor/bhn101. Epub 2008 Jun 11. Cereb Cortex. 2009. PMID: 18550596 Free PMC article.
-
Lineage Reprogramming of Astroglial Cells from Different Origins into Distinct Neuronal Subtypes.Stem Cell Reports. 2017 Jul 11;9(1):162-176. doi: 10.1016/j.stemcr.2017.05.009. Epub 2017 Jun 8. Stem Cell Reports. 2017. PMID: 28602612 Free PMC article.
References
-
- Andersen P. Interhippocampal impulses. II. Apical dendritic activation of CA1 neurons. Acta Physiol Scand. 1960;48:178–208. - PubMed
-
- Ashton AC, Ushkaryov YA. Properties of synaptic vesicle pools in mature central nerve terminals. J Biol Chem. 2005;280:37278–37288. - PubMed
-
- Chi P, Greengard P, Ryan TA. Synapsin dispersion and reclustering during synaptic activity. Nat Neurosci. 2001;4:1187–1193. - PubMed
-
- Chi P, Greengard P, Ryan TA. Synaptic vesicle mobilization is regulated by distinct synapsin I phosphorylation pathways at different frequencies. Neuron. 2003;38:69–78. - PubMed
MeSH terms
Substances
LinkOut - more resources
Full Text Sources
Miscellaneous

