. 2005 Nov 30;25(48):11092-106.
doi: 10.1523/JNEUROSCI.2981-05.2005.

Overexpression of the epidermal growth factor receptor confers migratory properties to nonmigratory postnatal neural progenitors

Affiliations

Overexpression of the epidermal growth factor receptor confers migratory properties to nonmigratory postnatal neural progenitors

Adan Aguirre et al. J Neurosci. .

Abstract

Approaches to successful cell transplantation therapies for the injured brain involve selecting the appropriate neural progenitor type and optimizing the efficiency of the cell engraftment. Here we show that epidermal growth factor receptor (EGFR) expression enhances postnatal neural progenitor migration in vitro and in vivo. Migratory NG2-expressing (NG2+) progenitor cells of the postnatal subventricular zone (SVZ) express higher EGFR levels than nonmigratory, cortical NG2+ cells. The higher endogenous EGFR expression in SVZ NG2+ cells is causally related with their migratory potential in vitro as well as in vivo after cell engraftment. EGFR overexpression in cortical NG2+ cells by transient transfection converted these cells to a migratory phenotype in vitro and in vivo. Finally, cortical NG2+ cells purified from a transgenic mouse in which the EGFR is overexpressed under the CNP promoter exhibited enhanced migratory capability. These findings reveal a new role for EGFR in the postnatal brain and open new avenues to optimize cell engraftment for brain repair.


Figures

Figure 1.
Figure 1.
Expression of EGFR and EGF in NG2+ cells of the postnatal brain. Immunostaining of sagittal sections from P8 CNP-EGFP mouse brains. aSVZ, Anterior SVZ; CTX, cerebral cortex. NG2+ cells express high levels of EGFR in the SVZ (a), RMS (b), and SCWM (c), respectively. Conversely, coronal sections show that, in cerebral cortex (d), NG2+ cells express levels of EGFR undetectable by immunohistochemistry. The individual cells selected for multi-marker illustration are indicated as boxed areas. Additional arrows indicate triple-positive cells. Dotted lines indicate the borders of the RMS. Optical sections (Z = 0.5 μm; X = 30 μm) of confocal epifluorescence images were sequentially acquired using a 60× oil objective (NA, 1.40) with Bio-Rad LaserSharp version 3.2 software. Confocal Assistant 4.02 was used to merge images. Merged images were processed in Photoshop 7.0 with minimal manipulations of contrast. Scale bar, 50 μm. e, f, Total protein extracts from FACS-purified NG2+ cells were analyzed by Western blot with selective anti-EGFR (e) and anti-EGF (f) antibodies. SVZ NG2+ cells express EGFR and EGF levels higher than cortical cells. SVZ tissue was used as a positive control. The blotted membrane was reprobed with anti-actin antibodies to determine equal protein loading (bottom panels).
Figure 2.
Figure 2.
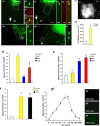
EGF promotes migration of SVZNG2+ cells. SVZ explants from the CNP-EGFP mouse were cocultured with BSA-soaked (a) and EGF-soaked (b) heparin beads. EGFP+ cells preferentially migrate toward EGF (b) compared with BSA beads (a). Arrows in a1 and b1 point to the position of the soaked bead. Dotted lines indicate the edges of the SVZ explants. High-magnification images obtained from the boxed areas in a1 and b1 are shown in a5 and b5, respectively. High-magnification images obtained from the boxed areas in a5 and b5 are shown in a6 and b6, respectively. A large percentage of the EGFP+ cells that were migrating in the presence of EGF (b2-b4) or remained within the explant with BSA (a2-a4) were NG2+. Migratory cells with EGF (b2-b4, b6) displayed a bipolar morphology distinct from nonmigratory cells with BSA (a2-a4, a6). c, Quantification of NG2+ cell migration in SVZ explants. c1, Are presentative SVZ explant from the CNP-EGFP mouse cultured in hydrogel and exposed to BSA (left, white dotted line) or EGF (right, yellow dotted line). Scale bar, 300 μm. c2, Histograms illustrate quantification of cell migration in SVZ explants, shown as average ± SEM of migrated area (in square micrometers). A total of 10 explants from three different experiments were analyzed. *p < 0.01. d-g, Cell migration was determined using microchemotaxis chambers (Boyden chambers). In all of the cases, data represent averages ± SEM of triplicate determinations from three different experiments. HPF, 40× magnification. d, Different growth factors were used in the lower chamber to stimulate migration in SVZ NG2+ cells. Note that EGF has the strongest effect on NG2+ cell migration. No GFs, No growth factors. Unpaired t test compared with no GFs, *p < 0.005, **p < 0.01; n.s., not significant. e, Cortical NG2+ cells do not migrate in presence of EGF, but they do in the presence of bFGF and PDGF. Unpaired t test compared with no GFs, *p < 0.0002, **p < 0.0005. f, TGFα promotes migration of SVZ NG2+ cells to a similar extent as EGF. Unpaired t test compared with no GFs, *p < 0.005, **p < 0.0001. g, Dose-response curve of the effect of EGF on SVZ NG2+ cell migration shows that the maximal effect of EGF occurs at 10-20 ng/ml. g2-g4, Example of SVZ NG2+ cells that migrated through the filters with different concentrations of EGF. Scale bars, 50 μm.
Figure 3.
Figure 3.
The EGFR is directly involved in migration of SVZ NG2+ cells. NG2+/EGFP+ cells were FACS purified from the SVZ of P8 CNP-EGFP mice. a, Migration of NG2+ cells depends on the EGF concentration gradient. Cell migration was measured in the presence of EGF in the lower chamber (dark circle, 10 ng/ml). The addition of EGF in the upper chamber (1-10 ng/ml) progressively reduces directional cell migration induced by EGF in the lower chamber. Cell migration in the absence of EGF was also measured (white oval). Unpaired t test compared with EGF in the lower chamber only, *p < 0.001; n.s., not significant. All data are represented as averages ± SEM of triplicate determinations in at least three independent experiments. b, The EGFR blocker PD168393 inhibits migration of NG2+ cells toward EGF (10 ng/ml) in a dose-dependent manner. Cells were preincubated with the PD168393 inhibitor for 30 min before seeding the cells in microchemotaxis chambers. Migration was assayed after 12 h. Unpaired t test compared with EGF alone, *p < 0.001. All data are represented as averages ± SEM of triplicate determinations in at least three independent experiments. c, The EGF-neutralizing antibody silences EGFR-associated signaling. Cells were preincubated with the EGF-neutralizing antibody (EGFNab; 2 μg/ml) or rabbit IgG (2 μg/ml) for 30 min, before stimulation with EGF (10 ng/ml). c1, Western blots using specific anti-phospho-EGFR and anti-EGFR antibodies and anti-phospho-PLCγ antibodies. Incubation of freshly purified SVZ NG2+ cells with anti-EGF neutralizing antibodies suppressed EGFR-associated signaling, as demonstrated by EGFR and PLCγ phosphorylation. The membranes were reprobed to show that equal levels of proteins were loaded, as shown by the antibody against total EGFR and total PLCγ (bottom panels). c2, Western blot using specific antibodies for pERK or total ERK. Incubation of purified SVZ NG2+ cells with EGF caused ERK phosphorylation, which was blocked by pretreatment with the anti-EGF neutralizing antibody (top). The membrane was reprobed to show that equal levels of proteins were loaded, as shown by the antibody against total ERK (bottom). d, The EGF-neutralizing antibody (EGFNab) inhibits directional migration of NG2+ cells induced by EGF. Cells were preincubated with EGF-neutralizing antibody (2 μg/ml) or rabbit IgG (IgGab; 2 μg/ml) for 30 min before stimulation with EGF (10 ng/ml). Migration was assayed after 12 h. Unpaired t test, EGF compared with no growth factors (No GFs), *p < 0.002; EGF + IgGab and EGF + EGFNab compared with EGF, NS and **p < 0.03, respectively.
Figure 4.
Figure 4.
EGFR and ECM components coparticipate to promote SVZ NG2+ cell migration. NG2+/EGFP+ cells were FACS purified from the SVZ of P8 CNP-EGFP mice. a, EGF promotes directional migration in the presence of different extracellular matrix components but not in the presence of poly-l-lysine. Unpaired t test compared with no growth factors (No GFs), *p < 0.001; n.s., not significant. b, EGF-induced directional migration involves integrin proteins. NG2+ cells were mixed with RGDS (integrin binding inhibitor, white squares) or RGD peptides (control peptide, dark squares) at the indicated doses, before loading onto the chambers. Cell migration with (10 ng/ml) or without EGF is indicated with black and white ovals, respectively. Unpaired t test, compared with EGF alone, *p < 0.001.
Figure 5.
Figure 5.
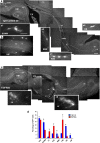
EGF-dependent migration of grafted SVZ NG2+ cells. NG2+/GFP+ cells were FACS purified from the SVZ of P8 Tg ActbGFP mice and transplanted into the LV of P4 wild-type host mice. Brains were analyzed 1WAT. GFP+ cells were visualized by fluorescence microscopy. a, Cells were treated with a control anti-IgG antibody before transplantation. Migrating GFP+ cells were found throughout the RMS (a2, a3) and in the OB (a4). Graft-derived GFP+ cells were also found in the SCWM (a1) and in the CA3 and stratum oriens (SO) of the hippocampus (b). c, FACS-purified NG2+/GFP+ cells were preincubated with the EGF-neutralizing antibody (EGFNab) before transplantation into the LV. Grafted NG2+/GFP+ cells treated with the EGF-neutralizing antibody did not migrate, and the majority of grafted cells were found attached to the parenchyma and in the ependymal layer of the LV (c1, c2). Dotted lines depict the RMS and hippocampus (a, c) and the CA3 area of the hippocampus (b). Scale bars: a, c, 300 μm; a1, all insets, 50 μm. d, Histograms represent percentages of total graft-derived GFP+ cells found in each region, including striatum (STR), SCWM, LV, fimbria (FIM), RMS, OB, and hippocampus (HIP) at 1WAT. IgGab, Control anti-IgG antibody; EGFNab, EGF-neutralizing antibody. These percentages were obtained from counting the cells found in each region and the total cells found in each brain after grafting. Blue bars are cells derived from grafted NG2+/GFP+ cells treated with the anti-IgG antibody before transplantation, and red bars indicate cells derived from grafted NG2+/GFP+ treated with the EGF-neutralizing antibody before transplantation. Data are shown as averages ± SEM from three to four independent experiments. Unpaired t test: STR, *p < 0.004; SCWM, *p < 0.0001; LV, *p < 0.02; SVZ, *p < 0.05; RMS, *p < 0.02; FIM, *p < 0.01; OB, *p < 0.001; HIP, *p < 0.005.
Figure 6.
Figure 6.
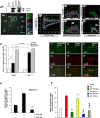
Overexpression of the hEGFR in nonmigratory cortical NG2+ cells promotes EGF-mediated migration in vitro. Cortical glial cultures were prepared from the cortex of Tg β-actin-GFP mice (P8) and were transfected with a wild-type hEGFR (phEGFR) or with a constitutively active EGFR construct (phEGFRviii). Cortical glial cultures were prepared from the cortex of FVB/NxCB6 mouse (P8) and were transfected with a pCMV-IRES-GFP (pmock) construct. a, Construct expression in NG2+ cells. a1, Western blot of cortical cultures 36 h after transfection with the pmock, phEGFR, or phEGFRviii demonstrates expression of EGFR. Cos-pEGFR, Cos cells transfected with phEGFR. a2, Cortical cultures were immunolabeled 36 h after transfection with anti-hEGFR (red) and anti-NG2 (blue) antibodies. b, Histograms of typical sorting profiles for NG2+/hEGFR+/GFP+ cells from cortical cultures transfected with the phEGFR construct. NG2 and hEGFR immunolabeling were scattered with PE-Cy5 (b2) and R-PE (b3), respectively. To scatter triple-positive (NG2+/hEGFR+/GFP+) cells, the NG2+/GFP+ fraction (R3 box in b3) was double sorted using PE-Cy5.5 for NG2 and RPE for hEGFR (R4 box in b5). Note that a significant percentage of NG2+/GFP+ cells expressed the hEGFR. All data are shown as means ± SEM obtained from a total of three to four separate experiments in triplicate. c, Transfected, FACS-purified cortical NG2+/mock-GFP+, NG2+/hEGFR+/GFP+, or NG2+/hEGFRviii+/GFP+ cells were used in migration assays in chemotaxis chambers. Cell migration was assayed 12 h after seeding the cells in microchemotaxis chambers. Overexpression of the hEGFR or hEGFRviii confers migratory properties to the cells. Note that, incortical NG2+/hEGFRviii+/GFP+ cells, migration is not modified by EGF, confirming the constitutive activity of the hEGFRviii construct. Unpaired t test, *p < 0.001, **p < 0.002, ***p < 0.01. For the phEGFRviii, the difference between EGF and no EGF was not significant. d, Images of migrated cells in chemotaxis chamber immunostained with anti-hEGFR antibodies 12 h after plating. Cortical NG2+/hEGFR+/GFP+ (d4-d9) but not NG2+/mock-GFP+ cells (d1-d3) that had migrated through the filters expressed the hEGFR. e, Migration of cortical NG2+/hEGFR+/GFP+ cells is inhibited by adding EGF to the upper chamber. Migration was assayed 12 h after seeding the cells in the microchemotaxis chambers. Unpaired t test compared with EGF in lower chamber only, *p < 0.01. f, EGF-induced migration of cortical NG2+/hEGFR+/GFP+ cells was inhibited by the EGFR blocker PD168393 and by the EGFR- and EGF-neutralizing antibodies (EGFRNab and EGFNab, respectively). Cells were preincubated with EGFNab (2 μg/ml), rabbit IgG (2 μg/ml), or the PD168393 inhibitor (0.7 nm) for 30 min before stimulation with EGF (10 ng/ml). Migration was assayed after 12 h. Unpaired t test (compared with EGF or EGFRNab compared with IgGab), *p < 0.01, **p < 0.0003, ***p < 0.005; n.s., not significant. Scale bars, 50 μm.
Figure 7.
Figure 7.
Overexpression of the hEGFR in nonmigratory cortical NG2+ cells promotes EGF-mediated migration in vivo. a, Cortical glial cultures from wt P8 FVB/NxCB6 mouse were transfected with a pCMV-IRES-GFP (mock-GFP), and NG2+/GFP+ cells were FACS purified. FACS-purified wt/NG2+/mock-GFP+ cells were transplanted in the LV of P4 wt host mice. Brains were analyzed at 1WAT. Graft-derived wt/mock-GFP+ cells were visualized by fluorescence microscopy after anti-GFP immunostaining. Cortical wt/mock-GFP+ cells displayed very restricted migration, with a small percentage of graft-derived cells found in the SCWM (a1). The majority of the graft-derived wt/mock-GFP+ cells were found in the parenchyma, in the fimbria (a2), and in the ependymal layer of the LV (a3). b, No cells were observed in the OB. c, Cortical glial cultures from Tg β-actin-GFP mice were transfected with a wild-type hEGFR (phEGFR), and Tg β-actin-GFP+/NG2+/hEGFR+ cells were FACS purified and transplanted into the LV as described in a. Brains were analyzed 1WAT. Graft-derived hEGFR+/GFP+ cells were found in the RMS (c2) and in the OB (d1). hEGFR+/GFP+ cells were also found in the SCWM (c1) and in the hippocampus (e, f). g, h, Immunostaining with a selective anti-hEGFR antibody shows that graft-derived Tg β-actin-GFP+/hEGFR+ cells in SCWM (h1-h4), but not wt/mock-GFP+ cells in the same brain region (g1-g4), express the hEGFR at 1WAT. i, Histograms represent percentages of total graft-derived cells found in each region, including striatum (STR), SCWM, fimbria (FIM), LV, SVZ, RMS, OB, and hippocampus (HIP) at 1WAT. These percentages were obtained from counting the cells found in each region and the total cells found in each brain after grafting. Blue bars are cells derived from grafted wt/NG2+/mock-GFP+ cells, and red bars indicate cells derived from grafted Tg β-actin-GFP+/NG2+/hEGFR+ cells. Dotted lines depict the hippocampus (a-e). Scale bars: a, b, c, d1, e, f, 300 μm; a1-a3, c1, c2, d2, e1, f1, g1-g4, h1-h4, 50 μm. Data are shown as means ± SEM from three independent experiments. Unpaired t test: STR, *p < 0.01; SCWM, *p < 0.0004; LV, *p < 0.0001; SVZ, *p < 0.008; FIM, *p < 0.01; RMS, *p < 0.02; OB, *p < 0.006; HIP, *p < 0.01.
Figure 8.
Figure 8.
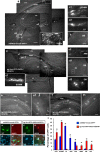
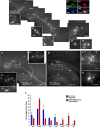
Cortical NG2+/hEGFR+ cells from the CNP-hEGFR mouse display extensive rostral and caudal migration after grafting. NG2+ cells were FACS purified from the cerebral cortex of P8 CNP-hEGFR mice and stained with DiI before transplantation into the LV of P4 wt host mice. a, Grafted NG2+/hEGFR+/DiI+ cells displayed extensive rostral and caudal migration 1WAT. Graft-derived cells were observed throughout the entire SCWM (a1), RMS (a2, a3), and into the OB (a4, a5). b, Graft-derived hEGFR+/DiI+ cells were still NG2+ and were immunostained with a selective anti-hEGFR antibody 1WAT. c, d, Graft-derived hEGFR+/DiI+ cells were also found in the hippocampus. Dotted lines depict the RMS (a) and hippocampus (c, d). High-magnification images obtained from the boxed areas are shown in a1-a5, c1-c3, d1, and d2. e, Histograms represent percentages of graft-derived cells found in each region, including striatum (STR), SCWM, fimbria (FIM), LV, SVZ, RMS, OB, and hippocampus (HIP) at 1WAT. These percentages were obtained from counting the cells found in each region and the total cells found in each brain after grafting. Blue bars are cells derived from grafted wt NG2+/DiI+ cells, and red bars indicate cells derived from grafted NG2+/hEGFR+/DiI+ cells. Scale bars: a, c, d, 300 μm; a1-a5, b1-b4, c1-c3, d1, d2, 50 μm. Unpaired t test, comparing EGFR-transfected versus mock-transfected cells: STR, *p < 0.05; SCWM, *p < 0.01; LV, *p < 0.02; SVZ, *p < 0.003; FIM, *p < 0.04; RMS, *p < 0.009; OB, *p < 0.004; HIP, *p < 0.003.
Figure 9.
Figure 9.
Cortical NG2+/hEGFR+ cells from the CNP-hEGFR mouse generate astrocytes and oligodendrocytes in the white matter after grafting. FACS-purified cortical NG2+/CNP-hEGFR+/GFP+ cells from a P8 CNP-hEGFR/Tg ActbGFP mouse were transplanted into the LV of P4 wt host mice. Tissue analysis was performed at 4WAT. a, Graft-derived hEGFR+/GFP+ cells migrating through the RMS still express NG2. b, Percentages of total graft-derived GFP+ cells found in the entire brain (see Materials and Methods) at 4WAT expressing differentiated phenotypes. hEGFR+/GFP+ cells were characterized based on CNP (oligodendrocytes), GFAP (astrocytes), or NeuN (neurons) expression by scoring the number of GFP+ cells double labeled with each antibody marker analyzed. Cell numbers were obtained from three different transplantation experiments (3 brains total). NI, Not identified by anti-NeuN, anti-CNP, or anti-GFAP immunostaining. Total GFP+ cells counted ranged between 1800 and 2470. Cell counting data are expressed as averages ± SEM. c, Example of graft-derived GFP+ cells found in the SCWM that display an astrocytic phenotype based on GFAP expression (c5, blue) and the absence of MBP (c4, red). d, A percentage of graft-derived hEGFR+/GFP+ cells found in the OB display a differentiated oligodendrocyte (OL) phenotype based on the expression of CNP (d6, blue). Scale bars: b, 20 μm; a, c, d, 50 μm.

Similar articles

Cited by

References

    1. Aguirre A, Gallo V (2004) Postnatal neurogenesis and gliogenesis in the olfactory bulb from NG2-expressing progenitors of the subventricular zone. J Neurosci 24: 10530-10541. - PMC - PubMed
    1. Aguirre AA, Chittajallu R, Belachew S, Gallo V (2004) NG2-expressing cells in the subventricular zone are type C-like cells and contribute to interneuron generation in the postnatal hippocampus. J Cell Biol 165: 575-589. - PMC - PubMed
    1. Alvarez-Buylla A, Herrera DG, Wichterle H (2000) The subventricular zone: source of neuronal precursors for brain repair. Prog Brain Res 127: 1-11. - PubMed
    1. Anton ES, Ghashghaei HT, Weber JL, McCann C, Fischer TM, Cheung ID, Gassmann M, Messing A, Klein R, Schwab MH, Lloyd KC, Lai C (2004) Receptor tyrosine kinase ErbB4 modulates neuroblast migration and placement in the adult forebrain. Nat Neurosci 7: 1319-1328. - PubMed
    1. Bagri A, Marin O, Plump AS, Mak J, Pleasure SJ, Rubenstein JL, Tessier-Lavigne M (2002) Slit proteins prevent midline crossing and determine the dorsoventral position of major axonal pathways in the mammalian forebrain. Neuron 33: 233-248. - PubMed

Publication types

MeSH terms