. 2005 Dec;11(12):1306-13.
doi: 10.1038/nm1320. Epub 2005 Nov 13.

The antioxidant function of the p53 tumor suppressor

Affiliations

The antioxidant function of the p53 tumor suppressor

Anna A Sablina et al. Nat Med. 2005 Dec.

Abstract

It is widely accepted that the p53 tumor suppressor restricts abnormal cells by induction of growth arrest or by triggering apoptosis. Here we show that, in addition, p53 protects the genome from oxidation by reactive oxygen species (ROS), a major cause of DNA damage and genetic instability. In the absence of severe stresses, relatively low levels of p53 are sufficient for upregulation of several genes with antioxidant products, which is associated with a decrease in intracellular ROS. Downregulation of p53 results in excessive oxidation of DNA, increased mutation rate and karyotype instability, which are prevented by incubation with the antioxidant N-acetylcysteine (NAC). Dietary supplementation with NAC prevented frequent lymphomas characteristic of Trp53-knockout mice, and slowed the growth of lung cancer xenografts deficient in p53. Our results provide a new paradigm for a nonrestrictive tumor suppressor function of p53 and highlight the potential importance of antioxidants in the prophylaxis and treatment of cancer.


Figures

Figure 1
Figure 1
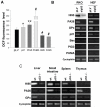
Effect of p53 status on intracellular ROS levels. We measured ROS levels by FACS following DCF staining and expressed as the mean ± sem intensity of cell fluorescence. (a) ROS level in p53-positive carcinoma cell lines A549 and RKO, and in normal human fibroblasts HEF, WI38, BJ and IMR90 after inhibition of p53 by expression of siRNA. As control we used non-specific siRNA to human papilloma virus HPV18 E6 gene. P < 0.04 compared to the correspondent cells with control vector by the Student t test. The lower panel shows expression levels of endogenous p53 protein in control and in si-p53 expressing cells, as detected by Western analysis with the antibody to p53 DO1. (b) ROS level in p53-negative MDAH041 human cell lines expressing siRNAs to p53 or E6. P > 0.94 compared to the cells with empty vector by the Student t test. (c) Effect of p53 inhibition by over-expression of p53 siRNA, p53 mutant His175, GSE22, HPV18 E6 gene and hdm2 protein on intracellular ROS. P < 0.04 compared to the cell with empty vector by the Student t test. (d) ROS levels in mouse splenocytes, thymocytes, spleen and lung fibroblasts from wild-type and p53-/- mice. We performed DCF staining immediately after isolation of splenocytes and thymocytes. The spleen and lung fibroblasts were at passage one. P < 0.05 compared to the correspondent wild type tissue by the Student t test.
Figure 2
Figure 2
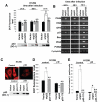
Activity of p53 is required for maintaining functional state of several antioxidant genes. (a) Different p53 target genes produce opposite effects on intracellular ROS levels. We expressed several p53-regulated genes in H1299 cells by infection with appropriate lentiviral constructs. Forty-eight hours after infection, intracellular ROS was detected by FACS following DCF staining. The ROS levels are expressed as the mean ± sem intensity of cell fluorescence, *P = 0.84, **P = 0.07, #P < 0.03 compared to the cells with empty vector by the Student t test. (b) Expression of HI95 (western analysis with polyclonal antibody to HI95) and PA26, GPX1, P21, BAX, PIG3, PUMA and PPIA (cyclophilin A) detected by RT-PCR in control RKO cells infected with empty vector or after inhibition of p53 by siRNA-expressing lentivirus. (c) levels of transcripts from the p53-regulated antioxidant genes in different organs of control and p53-/- mice (RT-PCR).
Figure 3
Figure 3
Opposite effects of p53 on ROS levels. (a,b) We infected H1299 cells with recombinant lentiviruses expressing wild-type p53 or the 22/23p53 mutant and measured ROS levels by FACS following DCF staining 24, 48 and 72 h after infection (expressed as the mean ± sem intensity of cell fluorescence; *P < 0.04, **P = 0.87, #P = 0.13 compared to the cells with empty vector by the Student t test). The lower panel shows the expression level of wild-type and mutant p53 proteins as visualized by Western analysis with the DO1 antibodies to p53. (b) RT-PCR analysis of different p53 target genes after expression of wild-type p53 or the 22/23p53 mutant in H1299 cells. (c) Mitochondria in control and π0 H1299 cells stained with MitoTracker Red. The lower panel shows the expression level of wild-type p53 and His175 p53 mutant in control and π0 H1299 cells 72 h after infection, as visualized by Western analysis with the DO1 antibody to p53. (d) ROS levels (DCF staining, *P < 0.04, **P > 0.90 compared to the cells with empty vector by the Student t test). (e) the proportion of Annexin V-labeled cells (*P < 0.02, **P > 0.83, compared to the cells with empty vector by the Student t test) were detected by FACS 72 h after infection.
Figure 4
Figure 4
Antioxidant effect of p53 after mild stress and pro-oxidant effect of p53 after grave stress. (a) Expression of endogenous p53 in RKO cells infected with empty vector or vector bearing siRNA to p53 in control and H2O2-treated cells. (b) FACS analysis of DCF fluorescence levels in untreated and H2O2-treated (12 h) RKO and RKO/sip53 cells. (c) Apoptosis levels 24 h after treatment with 0.2 and 1mM of H2O2, as detected by FACS following Annexin V staining, *P = 0.08 and **P = 0.01 compared to untreated cell by the Student t test. (d,e) Dose-dependence (24 h after treatment) and kinetics (treatment with 1mM H2O2) of the induction of p53-responsive genes following H2O2 treatment (Northern analysis).
Figure 5
Figure 5
p53 decreases DNA oxidation and mutagenesis. (a) p53 deficiency in lung fibroblasts from p53-/- mouse and in RKO cells with inhibited p53 increases 8-oxo-dG staining as measured by FACS following FITC-avidin staining. (b) 8-oxo-dG levels in spleens from wild-type and p53-/- mice as detected by FITC-avidin staining. (c,d) Expression of p53-regulated sestrins inhibits the elevation of intracellular ROS (c) and DNA oxidation (d) induced by down-regulation of p53. We measured ROS and 8-oxo-dG levels by FACS following DCF (left panel), or FITC-avidin (right panel) staining and expressed as the mean ± sem intensity of fluorescence, *P < 0.03, **P > 0.5 and #P < 0.09 compared to the cells expressing empty vector, by the Student t test. (e) Mutation frequency within HPRT locus in RKO and RKO/sip53 cells in the presence of NAC (5 mM). Colony formation assay of HAT-pre-selected RKO cells in the media containing 40 μg/ml 6-TG; *P = 0.02, **P > 0.85 and #P < 0.07 compared to the untreated cell expressing empty vector by the Student t test; (f) Mutation frequency in RKO cells with knocked-down p53 or different p53 target genes. Colony formation assay of RKO cells in the media containing 40 μg/ml 6-TG. Expression of p53 and HI95, P21 or PUMA was efficiently inhibited by corresponding siRNAs (Suppl. Fig 9a) two weeks before the assay; *P = 0.02, **P = 0.05 and #P > 0.89 compared to the cell expressing empty vector by the Student t test.
Figure 6
Figure 6
Elevated ROS in p53-negative tumors and in p53-/- mice contribute to accelerated tumor growth, karyotype instability and lymphomagenesis. (a) kinetics of xenografts growth with control and p53-deficient A549 cells (black lines) and the effect of NAC supplementation on tumor growth kinetics (grey lines); *P < 0.03 compared to A539/pLV cells, **P < 0.05 and #P = 0.84 compared to the cell inoculated to the correspondent control group of mice by the Student t test. (b) Intracellular ROS levels in splenocytes from p53-/- mice maintained on regular diet, and supplemented with NAC, as determined by FACS following DCF staining. Each bar represents average of the cell fluorescence intensity from three spleens; *P > 0.973 and **P = 0.05 compared to the control wild type mice by the Student t test. (c) Karyotype analysis of primary lung fibroblasts form 8-week old p53-/- mice maintained of regular and NAC-supplemented diets (average from cell cultures obtained from three mice); *P = 0.02 compared to the control p53-/- mice by the Student t test. (d) Effect of NAC supplementation on the survival of p53-/- mice. Viability of 25 animals maintained on a regular diet, and 25 animals supplemented with 40 mM NAC in drinking water was monitored over period of 250 days. The NAC-supplementation started with the pregnant female and continued through lifetime. Number of survived animals was scored with 10 days intervals. A log-rank test comparing two populations yields a two sided distributions, P value 0.005.

Comment in

Similar articles

Cited by

References

    1. Lane DP. p53, guardian of the genome. Nature. 1992;358:15–16. - PubMed
    1. Droge W. Free radicals in the physiological control of cell function. Physiol Rev. 2002;82:47–95. - PubMed
    1. Finkel T. Oxidant signals and oxidative stress. Curr Opin Cell Biol. 2003;15:247–254. - PubMed
    1. Jackson AL, Loeb LA. The contribution of endogenous sources of DNA damage to the multiple mutations in cancer. Mutat Res. 2001;477:7–21. - PubMed
    1. Klungland A, et al. Accumulation of premutagenic DNA lesions in mice defective in removal of oxidative base damage. Proc Natl Acad Sci U S A. 1999;96:13300–13305. - PMC - PubMed

Publication types

MeSH terms