

CTLA-4 and PD-1 receptors inhibit T-cell activation by distinct mechanisms
- PMID: 16227604
- PMCID: PMC1265804
- DOI: 10.1128/MCB.25.21.9543-9553.2005
CTLA-4 and PD-1 receptors inhibit T-cell activation by distinct mechanisms
Abstract
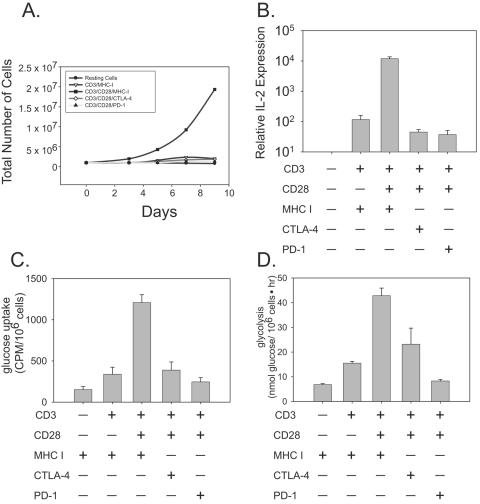
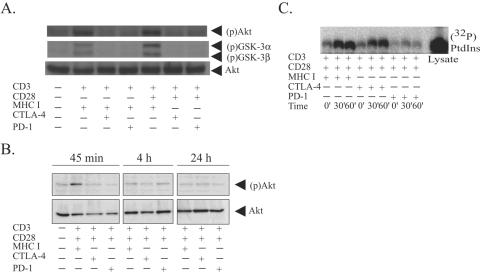
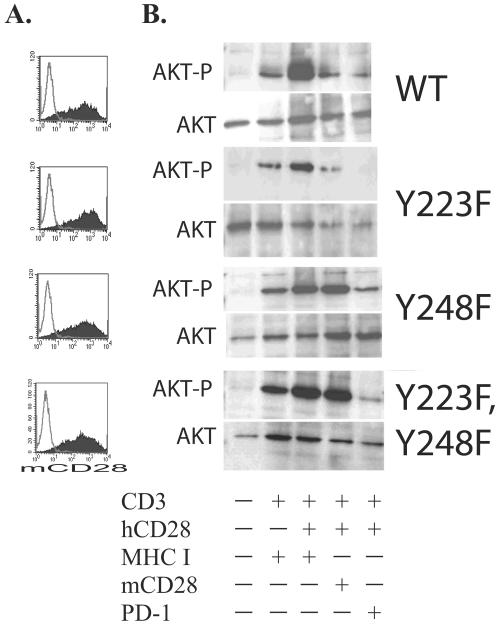
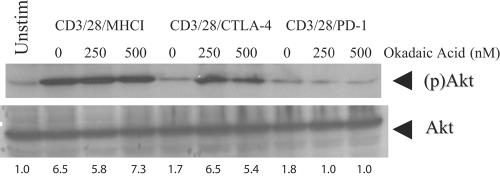
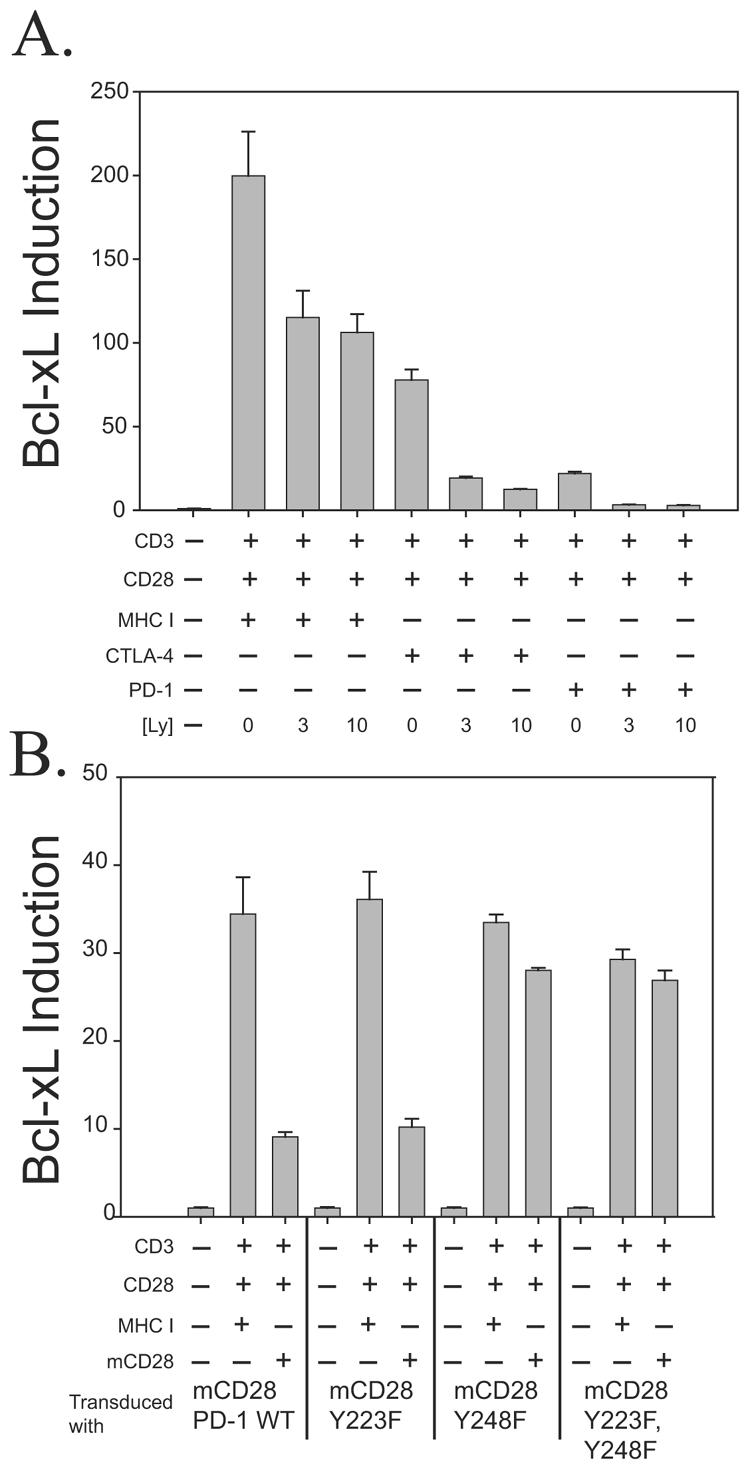
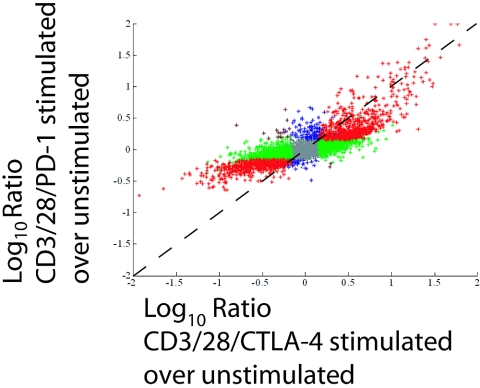
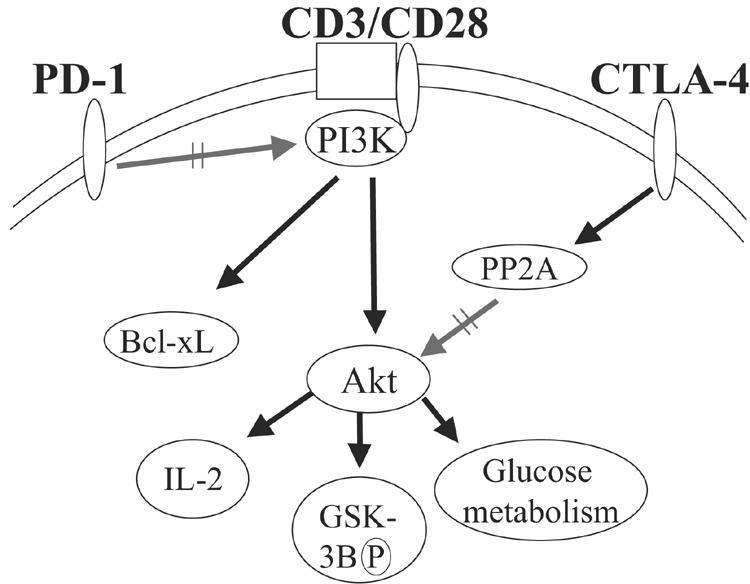
CTLA-4 and PD-1 are receptors that negatively regulate T-cell activation. Ligation of both CTLA-4 and PD-1 blocked CD3/CD28-mediated upregulation of glucose metabolism and Akt activity, but each accomplished this regulation using separate mechanisms. CTLA-4-mediated inhibition of Akt phosphorylation is sensitive to okadaic acid, providing direct evidence that PP2A plays a prominent role in mediating CTLA-4 suppression of T-cell activation. In contrast, PD-1 signaling inhibits Akt phosphorylation by preventing CD28-mediated activation of phosphatidylinositol 3-kinase (PI3K). The ability of PD-1 to suppress PI3K/AKT activation was dependent upon the immunoreceptor tyrosine-based switch motif located in its cytoplasmic tail, adding further importance to this domain in mediating PD-1 signal transduction. Lastly, PD-1 ligation is more effective in suppressing CD3/CD28-induced changes in the T-cell transcriptional profile, suggesting that differential regulation of PI3K activation by PD-1 and CTLA-4 ligation results in distinct cellular phenotypes. Together, these data suggest that CTLA-4 and PD-1 inhibit T-cell activation through distinct and potentially synergistic mechanisms.
Figures
Similar articles
-
The CD28 and CTLA-4 receptors associate with the serine/threonine phosphatase PP2A.Immunity. 2000 Sep;13(3):313-22. doi: 10.1016/s1074-7613(00)00031-5. Immunity. 2000. PMID: 11021529
-
Regulation of cytotoxic T lymphocyte-associated molecule-4 by Src kinases.J Immunol. 1999 Feb 1;162(3):1270-7. J Immunol. 1999. PMID: 9973379
-
CTLA-4-Mediated inhibition of early events of T cell proliferation.J Immunol. 1999 May 15;162(10):5813-20. J Immunol. 1999. PMID: 10229815
-
Expression and functional significance of CTLA-4, a negative regulator of T cell activation.Arch Immunol Ther Exp (Warsz). 2001;49(1):39-46. Arch Immunol Ther Exp (Warsz). 2001. PMID: 11266089 Review.
-
CD28 and CTLA-4 coreceptor expression and signal transduction.Immunol Rev. 2009 May;229(1):12-26. doi: 10.1111/j.1600-065X.2009.00770.x. Immunol Rev. 2009. PMID: 19426212 Free PMC article. Review.
Cited by
-
Strength of PD-1 signaling differentially affects T-cell effector functions.Proc Natl Acad Sci U S A. 2013 Jul 2;110(27):E2480-9. doi: 10.1073/pnas.1305394110. Epub 2013 Apr 22. Proc Natl Acad Sci U S A. 2013. PMID: 23610399 Free PMC article.
-
PD-1 restraint of regulatory T cell suppressive activity is critical for immune tolerance.J Exp Med. 2021 Jan 4;218(1):e20182232. doi: 10.1084/jem.20182232. J Exp Med. 2021. PMID: 33045061 Free PMC article.
-
Combination therapy with anti-CTLA-4 and anti-PD-1 leads to distinct immunologic changes in vivo.J Immunol. 2015 Feb 1;194(3):950-9. doi: 10.4049/jimmunol.1401686. Epub 2014 Dec 24. J Immunol. 2015. PMID: 25539810 Free PMC article.
-
Programmed death ligand 2 in cancer-induced immune suppression.Clin Dev Immunol. 2012;2012:656340. doi: 10.1155/2012/656340. Epub 2012 Apr 29. Clin Dev Immunol. 2012. PMID: 22611421 Free PMC article. Review.
-
PD-1 mediates functional exhaustion of activated NK cells in patients with Kaposi sarcoma.Oncotarget. 2016 Nov 8;7(45):72961-72977. doi: 10.18632/oncotarget.12150. Oncotarget. 2016. PMID: 27662664 Free PMC article.
References
-
- Agata, Y., A. Kawasaki, H. Nishimura, Y. Ishida, T. Tsubata, H. Yagita, and T. Honjo. 1996. Expression of the PD-1 antigen on the surface of stimulated mouse T and B lymphocytes. Int. Immunol. 8:765-772. - PubMed
-
- Appleman, L. J., A. A. Van Puijenbroek, K. M. Shu, L. M. Nadler, and V. A. Boussiotis. 2002. CD28 costimulation mediates down-regulation of p27kip1 and cell cycle progression by activation of the PI3K/PKB signaling pathway in primary human T cells. J. Immunol. 168:2729-2736. - PubMed
-
- Baroja, M. L., L. Vijayakrishnan, E. Bettelli, P. J. Darlington, T. A. Chau, V. Ling, M. Collins, B. M. Carreno, J. Madrenas, and V. K. Kuchroo. 2002. Inhibition of CTLA-4 function by the regulatory subunit of serine/threonine phosphatase 2A. J. Immunol. 168:5070-5078. - PubMed
-
- Barthel, A., S. T. Okino, J. F. Liao, K. Nakatani, J. P. Li, J. P. Whitlock, and R. A. Roth. 1999. Regulation of GLUT1 gene transcription by the serine threonine kinase Akt1. J. Biol. Chem. 274:20281-20286. - PubMed
-
- Bennett, F., D. Luxenberg, V. Ling, I. M. Wang, K. Marquette, D. Lowe, N. Khan, G. Veldman, K. A. Jacobs, V. E. Valge-Archer, M. Collins, and B. M. Carreno. 2003. Program death-1 engagement upon TCR activation has distinct effects on costimulation and cytokine-driven proliferation: attenuation of ICOS, IL-4, and IL-21, but not CD28, IL-7, and IL-15 responses. J. Immunol. 170:711-718. - PubMed
Publication types
MeSH terms
Substances
Grants and funding
LinkOut - more resources
Full Text Sources
Other Literature Sources