. 2005 Dec 2;280(48):39772-85.
doi: 10.1074/jbc.M505834200. Epub 2005 Oct 3.

Reassembly of active caspase-3 is facilitated by the propeptide

Affiliations

Reassembly of active caspase-3 is facilitated by the propeptide

Brett Feeney et al. J Biol Chem. .

Abstract

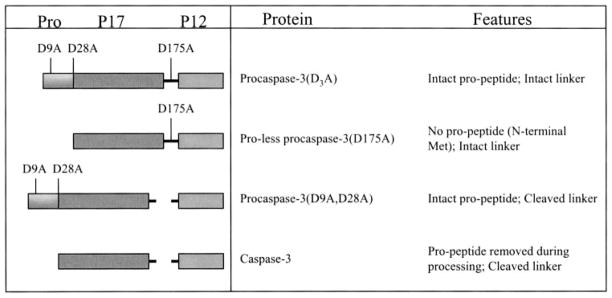
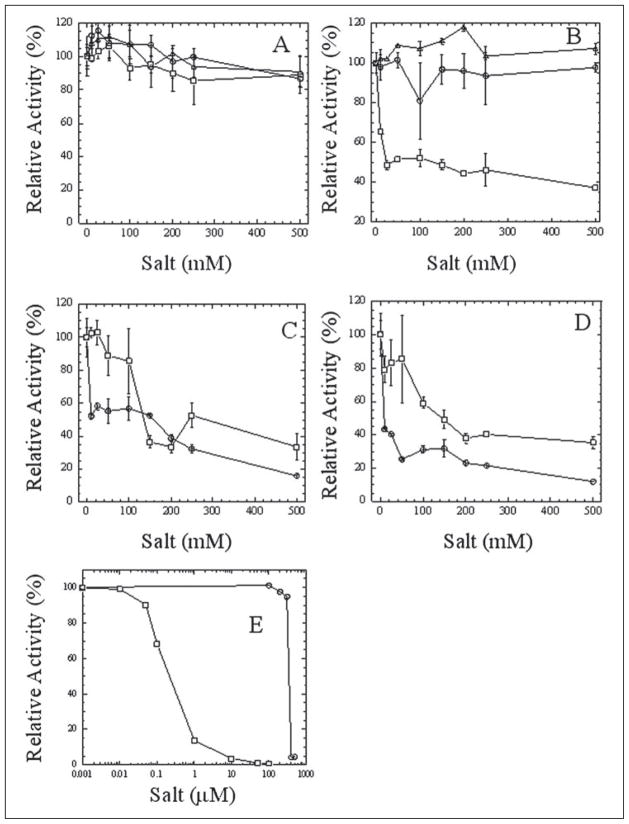
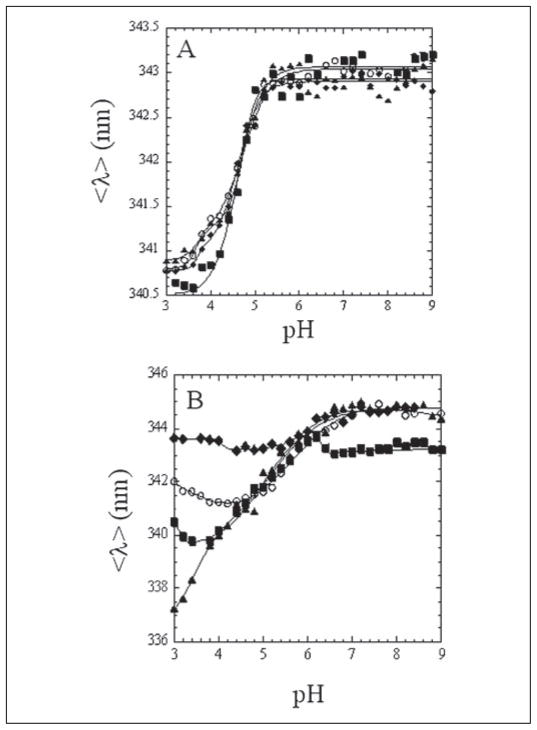
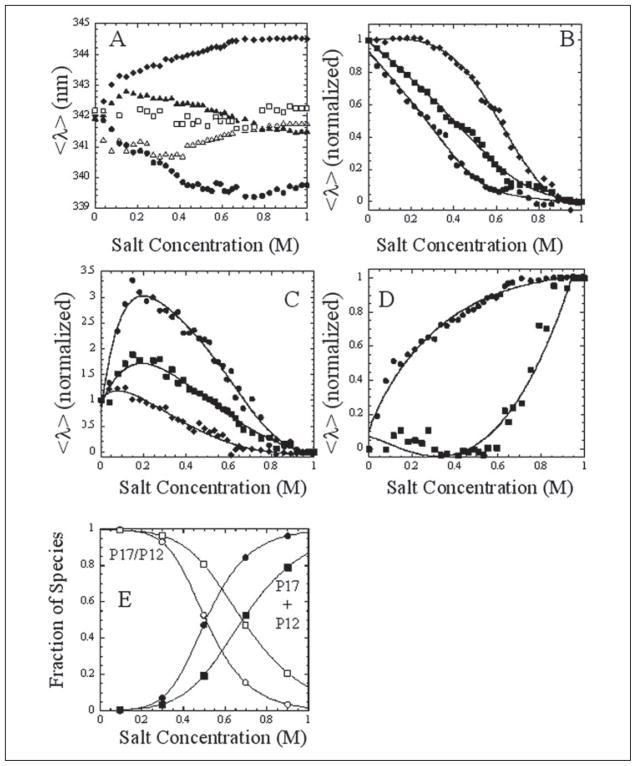
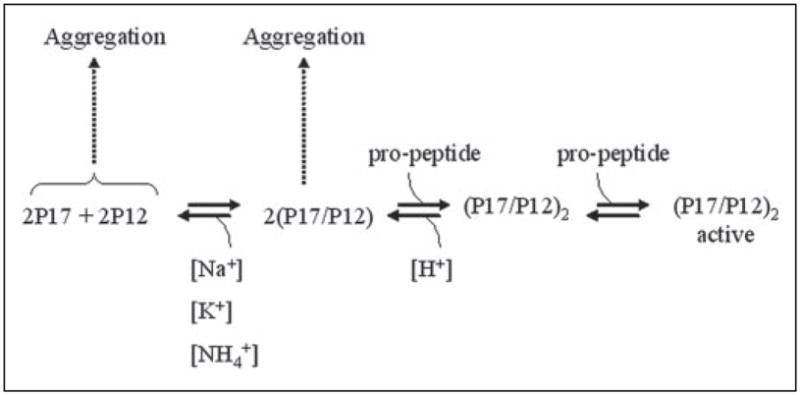
Changes in ionic homeostasis are early events leading up to the commitment to apoptosis. Although the direct effects of cations on caspase-3 activity have been examined, comparable studies on procaspase-3 are lacking. In addition, the effects of salts on caspase structure have not been examined. We have studied the effects of cations on the activities and conformations of caspase-3 and an uncleavable mutant of procaspase-3 that is enzymatically active. The results show that caspase-3 is more sensitive to changes in pH and ion concentrations than is the zymogen. This is due to the loss of both an intact intersubunit linker and the prodomain. The results show that, although the caspase-3 subunits reassemble to the heterotetramer, the activity return is low after the protein is incubated at or below pH 4.5 and then returned to pH 7.5. The data further show that the irreversible step in assembly results from heterotetramer rather than heterodimer dissociation and demonstrate that the active site does not form properly following reassembly. However, active-site formation is fully reversible when reassembly occurs in the presence of the prodomain, and this effect is specific for the propeptide of caspase-3. The data show that the prodomain facilitates both dimerization and active-site formation in addition to stabilizing the native structure. Overall, the results show that the prodomain acts as an intramolecular chaperone during assembly of the (pro)caspase subunits and increases the efficiency of formation of the native conformation.


Figures

FIGURE 1
FIGURE 1. Schematic diagrams of caspase-3 proteins used in this study
Pro refers to the prodomain. P17 and P12 are the large (17 kDa) and small (12 kDa) subunits, respectively. Features of each protein are listed to the right.
FIGURE 2
FIGURE 2. Relative activity versus salt concentration
A, activity of caspase-3 in the presence of Na+ (○), K+ (□), or NH4+ (△); B, activity of procaspase-3(D3A) in the presence of Na+ (○), K+ (□), or NH4+ (△); C, activity of caspase-3 in the presence of Mg2+ (□) or Ca2+ (○); D, activity of procaspase-3(D3A) in the presence of Mg 2+ (□) or Ca2+ (○); E, activity of caspase-3 (□) or procaspase-3(D3A) (○) in the presence of Zn2+. For A–E, the activity was compared with that of a control as described under “Experimental Procedures.” Error bars show the S.E. from at least three independent experiments.
FIGURE 3
FIGURE 3. Fluorescence average emission wavelength (〈λ〉) versus pH in the presence of salts
A, procaspase-3(D3A); B, caspase-3. For A and B, the following salts were examined: no salt (○), 1 M NaCl (▲), 1 M KCl (■), or 1 M NH4Cl (◆). Solid lines represent fits of the data as described under “Experimental Procedures.”
FIGURE 4
FIGURE 4. Changes in fluorescence average emission wavelength (〈λ〉) versus salt concentration
A, caspase-3 was incubated at pH 3 as described under “Experimental Procedures” to allow heterotetramer dissociation and then titrated with NaCl (●), KCl (▲), NH4Cl (◆), MgCl2 (△), or CaCl2 (□). B, titrations were performed as described for A in the presence of NaCl at caspase-3 concentrations of 2 (●), 4 (■), and 12 (◆) μM. C, titrations were performed as described for A in the presence of KCl at caspase-3 concentrations of 2 (●), 4 (■), and 12 (◆) μM. D, titrations were performed as described for A in the presence of NH4Cl at caspase-3 concentrations of 2 (●) and 10 (■) μM. In B and C, the data were normalized relative to the starting and ending values of 〈λ〉. In D, the data were normalized relative to the ending and starting values of 〈λ〉 so that the changes were consistent with those shown in A. Solid lines represent fits of the data as described in the text. E, fraction of heterodimer (open symbols) and subunits (closed symbols) calculated from fits of the data in B. Representative data are shown for 4 (circles) and 12 (squares) μM protein.
FIGURE 5
FIGURE 5. Proposed model for the effects of cations on caspase assembly
P17 is the large subunit (17 kDa); P12 is the small subunit (12 kDa); P17/P12 is the heterodimer; and (P17/P12)2 is the heterotetramer. The model shows that an increase in [H+] (decrease in pH) facilitates dissociation of the heterotetramer, whereas an increase in [Na+], [K+], or [ NH4+] facilitates dissociation of the heterodimer.
FIGURE 6
FIGURE 6. (Pro)caspase-3 activity recovery upon reassembly
A, shown is the relative activity of procaspase-3(D3A) in the presence of salts. Protein was incubated with 1 M monovalent or 0.5 M divalent salts as described under “Experimental Procedures” at pH 7.5 or 3.0. Samples were subsequently dialyzed at pH 7.5 to remove the salts, and the activity was measured. B, shown is the relative activity of caspase-3 in the presence of salts at pH 7.5. Following the initial incubation, samples were dialyzed at pH 7.5 to remove the salts, and the activity was measured. C, caspase-3 was incubated at pH 3.0 in the presence of salts. Following the initial incubation, samples were dialyzed at pH 3.0 to remove the salts and then at pH 7.5 to adjust the pH, and the activity was measured. D, caspase-3 was incubated at pH 3.0 in the presence of salts. Following the initial incubation at pH 3.0, samples were dialyzed at pH 7.5 to adjust the pH, but the salts were retained. The samples were then dialyzed at pH 7.5 to remove the salts, and the activity was measured. E, caspase-3 was incubated at the indicated pH without salts as described under “Experimental Procedures”; the pH was then returned to 7.5; and the activity was measured. For A–E, activities were compared with those of controls as described under “Experimental Procedures.” Error bars show the S.E. from at least three independent experiments.
FIGURE 7
FIGURE 7. Time-dependent loss of activity
A, caspase-3 in the presence of 1 mM DTT (○), 10 mM DTT (□), or 15 μM propeptide (△); B, caspase-3 in the presence of 1 mM DTT (○), 1 M KCl (□), or 0.5 M MgCl2 (△); C, procaspase-3(D9A,D28A) in the presence of 1 mM DTT (○), 10 mM DTT (□), or 0.5 M MgCl2 (△). Note that the results for caspase-3 in the presence of 1 mM DTT are presented in A and B for comparison with the other conditions. In all cases, the caspase concentration was 1 μM. Error bars show the S.E. from at least three independent experiments.
FIGURE 8
FIGURE 8. Efficiency of subunit reassembly
A, caspase-3 solubility as a function of protein concentration. Caspase-3 was initially incubated at pH 4, and the pH was then readjusted to 7.5. Solubility was measured as the absorbance at 280 nm remaining in a clarified solution as described under “Experimental Procedures.” B, relative activity of samples in A. In each case, the activity was compared with that of a control of equal concentration that had been incubated at pH 7.5. C, caspase-3 incubated initially at pH 4 in the presence of various concentrations of prodomains from caspase-3 (●), caspase-6 (○), and caspase-7 (△). The pH was readjusted to pH 7.5, and the activity was measured. Activities were compared with that of a control as described under “Experimental Procedures.” Changes in solubility at each propeptide concentration are shown (◆). D, pro-less procaspase-3(D175A) solubility as a function of protein concentration. E, relative activity of samples in D. F, return of activity for pro-less procaspase-3(D175A) incubated initially at pH 4 in the presence of various concentrations of caspase-3 prodomain (●), followed by return to pH 7.5. Changes in solubility at each propeptide concentration are shown (○). G, procaspase-3(D9A,D28A) solubility as a function of protein concentration. H, relative activity of samples in G. I, procaspase-3(D3A) solubility as a function of protein concentration. J, relative activity of samples in I. For all panels, error bars indicate the S.E. from at least three independent experiments. Solid lines are meant as guides and do not represent fits of the data to specific models.
FIGURE 9
FIGURE 9. Proposed model for assembly of the caspase-3 subunits
Subunits P17 and P12 assemble into a heterodimer (P17/P12). The assembly step is dependent on the cation concentration, and either the subunits or the heterodimer or both aggregate at higher protein concentrations. Two heterodimers assemble into an inactive heterotetramer ((P17/P12)2), which then isomerizes to the native active conformation. Assembly of the heterotetramer is sensitive to [H+]. The propeptide assists in formation of the inactive and/or active heterotetramer. The propeptide also stabilizes the native conformation.

Similar articles

Cited by

References

    1. Earnshaw WC, Martins LM, Kaufmann SH. Annu Rev Biochem. 1999;68:383–424. - PubMed
    1. Tewari M, Quan LT, O’Rouke K, Desnoyers S, Zeng Z, Beidler DR, Poirier GG, Salvesen GS, Dixit VM. Cell. 1995;81:801–809. - PubMed
    1. Fearnhead HO, McCurrach ME, O’Neill J, Zhang K, Lowe SW, Lazebnik YA. Genes Dev. 1997;11:1266–1276. - PubMed
    1. Deckwerth TL, Johnson EM., Jr Ann N Y Acad Sci. 1993;679:121–131. - PubMed
    1. Datta R, Banach D, Kojima H, Talanian RV, Alnemri ES, Wong WW, Kufe DW. Blood. 1996;88:1936–1943. - PubMed

Publication types

MeSH terms