Comparative Study
. 2005 Oct 5;24(19):3470-81.
doi: 10.1038/sj.emboj.7600777. Epub 2005 Sep 8.

ER stress-regulated translation increases tolerance to extreme hypoxia and promotes tumor growth

Affiliations
Comparative Study

ER stress-regulated translation increases tolerance to extreme hypoxia and promotes tumor growth

Meixia Bi et al. EMBO J. .

Abstract

Tumor cell adaptation to hypoxic stress is an important determinant of malignant progression. While much emphasis has been placed on the role of HIF-1 in this context, the role of additional mechanisms has not been adequately explored. Here we demonstrate that cells cultured under hypoxic/anoxic conditions and transformed cells in hypoxic areas of tumors activate a translational control program known as the integrated stress response (ISR), which adapts cells to endoplasmic reticulum (ER) stress. Inactivation of ISR signaling by mutations in the ER kinase PERK and the translation initiation factor eIF2alpha or by a dominant-negative PERK impairs cell survival under extreme hypoxia. Tumors derived from these mutant cell lines are smaller and exhibit higher levels of apoptosis in hypoxic areas compared to tumors with an intact ISR. Moreover, expression of the ISR targets ATF4 and CHOP was noted in hypoxic areas of human tumor biopsy samples. Collectively, these findings demonstrate that activation of the ISR is required for tumor cell adaptation to hypoxia, and suggest that this pathway is an attractive target for antitumor modalities.


Figures

Figure 1
Figure 1
Extreme hypoxia induces ATF4 and CHOP upregulation in a PERK-dependent manner. PERK+/+ and PERK−/− MEFs were exposed to ⩽0.02% O2 or treated with 1 μM thapsigargin for the times indicated. (A) Immunoblots with anti-ATF4, anti-CHOP, anti-BiP and anti-β-actin (loading control). Different time points are used since induction of ATF4 occurs much earlier than CHOP or BiP. (B) Northern blot analysis of UPR mRNAs following hypoxia and thapsigargin treatments. PERK+/+ and PERK−/− MEFs were treated as in (A). Blotting for α-tubulin was used as a loading control. (C) Translation efficiency of CHOP mRNA following hypoxia. PERK+/+ and PERK−/− MEFs were treated as in (A) and lysates were subjected to sucrose gradient sedimentation. Polysome profiles shown are from cell lysates of aerobic and hypoxic PERK+/+ cells. The positions of the 40S and 60S subunits as well as the polysomal RNA are indicated. (D) The amounts of CHOP, β-actin and 18S mRNA were determined by real-time quantitative PCR in each of the polysome fractions. The gray column indicates the polysome fraction used for quantitative PCR. Values plotted represent the total amount of CHOP mRNA found within the polysomes relative to β-actin. Also shown is the total cellular amount of CHOP found in the PERK+/+ and PERK−/− MEFs normalized to β-actin as determined by quantitative RT–PCR.
Figure 2
Figure 2
PERK confers resistance to hypoxia-induced apoptosis. (A–C) PERK+/+ and PERK−/− MEFs were exposed to ⩽0.02% O2 or treated with 500 nM thapsigargin for the indicated times before immunoblotting with antibodies specific for procaspase-12 (A), cleaved caspase-3 or anti-β-actin (B), or cleaved and uncleaved PARP (C).
Figure 3
Figure 3
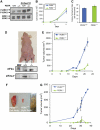
PERK affects the rate of tumor growth in vivo. (A) Immunoblot of untransformed PERK+/+ and PERK−/− MEFs, and MEFs stably transformed with Ki-RasV12, using a phospho-specific anti-ERK1/2 antibody (top), or an antibody against total ERK1 and ERK2 (bottom). (B) Growth rates of Ki-RasV12-transformed PERK+/+ and PERK−/− MEFs in vitro. (C) PERK+/+.Ki-RasV12 and PERK−/−.Ki-RasV12 MEFs form colonies in soft agar at similar rates. (D) Top, picture of a representative nude mouse injected with PERK+/+.Ki-RasV12 MEFs (left flank) and PERK−/−.Ki-RasV12 MEFs (right flank) with 3 × 10⁶ cells/site at 22 days following injection. The bottom panel shows eIF2α phosphorylation levels from the excised tumors shown in the top panel. Tumor sections were homogenized and immunoblotted for phospho-eIF2α and total-eIF2α. (E) PERK+/+ (blue line and squares) and PERK−/− (green line and triangles) tumor volumes from seven animals monitored over a period of 22 days following inoculation (mean±s.e.). (F) Tumors from a mouse injected with clone #2 PERK+/+.Ki-RasV12 MEFs (left) or clone #2 PERK−/−.Ki-RasV12 MEFs (right). (G) Growth of PERK+/+.Ki-RasV12#2 (blue line and rectangles) and PERK−/−.Ki-RasV12#2 (green line and triangles) tumors (N=4) monitored over a period of 37 days (mean±s.e.).
Figure 4
Figure 4
Hypoxic areas in PERK−/− but not in PERK+/+ tumors overlap with areas of apoptosis. (A) Sections of PERK−/− tumors (a−f) or PERK+/+ tumors (g−l) were incubated with a Cy3-conjugated antibody to EF-5 adducts (hypoxia, red) (b, e and h, k), followed by incubation with a FITC-conjugated anti-cleaved caspase-3 antibody (apoptosis, green) (a, d and g, j). Panels c, f and i, l are merged images showing both apoptotic and hypoxia areas. Two different PERK−/− (a−c and d−f) and PERK+/+ (g−i and j−l) tumor sections are shown. Bar=15 μm (a−i) and 60 μm (j−l). (B) Quantitation of four independent field images from PERK+/+ or PERK−/− tumors. The number of apoptotic cells in hypoxic (EF-5 positive) and normoxic (EF-5 negative) areas of each image were automatically counted and expressed as a percentage of the total number of apoptotic cells in the image. Error bars represent s.e. values.
Figure 5
Figure 5
MEFs with nonphosphorylatable eIF2α mutant are more sensitive to extreme hypoxia than WT MEFs. (A) WT and S51A MEFs were exposed to ⩽0.02% O2 or treated with 1 μM thapsigargin before immunoblotting with anti-phospho-eIF2α or anti-total-eIF2α antibodies. (B) WT and S51A MEFs transformed with SV40/Ha-RasV12 were exposed to extreme hypoxia (⩽0.02% O2) and then photographed using phase-contrast microscopy. (C) Reduced clonogenic survival of S51A MEFs after hypoxia compared to WT MEFs. (D) Reduced survival of S51A MEFs after hypoxia compared to WT MEFs, as measured by clonogenic survival assay. Cells were treated as in (C). Experiments were performed in triplicate and error bars represent standard errors. (E) WT and S51A MEFS transformed with SV40/Ha-RasV12 were exposed to hypoxia or treated with 500 nM thapsigargin before immunoblotting for cleaved caspase-3, PARP or β-actin.
Figure 6
Figure 6
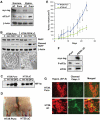
Inhibition of eIF2α phosphorylation affects the rate of tumor growth in vivo. (A) Nu/Nu mice were injected on each side with 1 × 10⁶ cells/site, with either WT.Ha-RasV12 MEFs (left panel) or S51A.Ha-RasV12 MEFs (right panel). Necrotic areas on the skin and opaque morphology are evident in the S51A.Ha-RasV12 tumors. (B) Tumor growth after 3 weeks. At the end of the experiment, tumors were excised and weighed (mean±s.e., N=7, *P<0.05, one-tailed Student's t-test). (C) VEGF levels following hypoxia in WT and S51A MEFs. Ras-transformed MEFs were treated as in Figure 5A and secreted VEGF levels in the media were analyzed at the times indicated. Experiments were performed in triplicate and error bars represent s.e. values. (D) ATF4 upregulation in hypoxic areas is dependent on eIF2α phosphorylation. Tumor xenografts from Ha-RasV12-transformed WT and S51A cells were stained for ATF4 expression. Staining for ATF4 was observed only in WT tumors and localized within hypoxic regions. No significant staining was seen in 6/6 sections from three different S51A tumors. Bar=15 μm.
Figure 7
Figure 7
Expression of a dn-PERK allele in human tumor cells decreases hypoxia tolerance and inhibits tumor growth. (A) Immunoblot of myc-tagged PERKΔC, eIF2α phosphorylation and β-actin (loading control). Exposure of HT29.Puro cells to extreme hypoxia induces an increase in eIF2α phosphorylation, which is blocked in HT29.PERKΔC cells. (B) Immunoblot of uncleaved and cleaved PARP in HT29.Puro and HT29.PERKΔC cells following hypoxia or 12 h treatment with 500 nM thapsigargin (top). β-Actin was used as a loading control. Apoptotic morphology following extreme hypoxia for 48 h at × 40 magnification (bottom). Arrowheads indicate cells with membrane blebbing and arrows indicate cells exhibiting vacuoles, a sign of ER stress. (C) PERK status does not affect induction of HIF-1α levels. HT29.Puro and HT29.PERKΔC cells were treated with extreme hypoxia or DFO. HIF-1α levels were determined by immunoblotting using nuclear extracts. (D) Tumor xenografts from HT29.Puro cells (left mouse) grow larger compared to tumors from HT29.PERKΔC cells (right mouse). (E) Growth measurements of HT29.Puro xenografts (blue line and squares) and HT29.PERKΔC xenografts (green line and triangles). Growth from six tumors was monitored over a period of 25 days following injection (mean±s.e.) (*P<0.05). (F) Immunoblot analysis of PERKΔC expression, eIF2α phosphorylation status or total eIF2α levels from excised and homogenized tumors shown in (D, E). (G) Sections from HT29.Puro and HT29.PERKΔC xenografts were stained for regions of hypoxia using a Cy-3-labeled anti-EF-5 antibody and apoptosis using an anti-cleaved caspase-3, FITC-labeled antibody. The merged images are shown on the right.
Figure 8
Figure 8
ATF4 contributes to hypoxia tolerance, and ATF4 and CHOP are upregulated in hypoxic areas of primary human tumors. (A) Cells were exposed to extreme hypoxia for 24 h and photographed for apoptotic morphology at × 100 magnification. (B) Immunoblot of cleaved caspase-3 (top) or uncleaved and cleaved PARP (bottom) following hypoxia. (C) MTT assay of ATF4+/+ and ATF4−/− MEFs following exposure to moderate hypoxia (1% O2) or treatment with a 4 Gy dose of IR. Experiments were performed in triplicate and results are normalized to control levels. Error bars represent s.e. values (*P<0.05). No significant difference in survival was observed between untreated ATF4+/+ and ATF4−/− MEFs. (D) Immunofluorescence for ATF4 and hypoxia (a−f), or CHOP and hypoxia (g−l) in primary human cervical tumors. Sections were stained with anti-ATF4 (a, d) or anti-CHOP (g, j) polyclonal antibodies followed by a FITC-conjugated secondary antibody, and with a Cy-3-labeled anti-Pimonidazole antibody (b, e, h, k). Panels c, f, i and l are combined images of (a+b), (d+e), (g+h), (j+k), respectively. Bar=15 μm (a−c, g−i) and 30 μm (d−f, j−i). (E) Immunoblot of ATF4 in lysates from human GBMs and normal human brain tissue. (F) Analysis of ATF4 levels (normalized to levels of β-actin) in normal and malignant tissues obtained from human patients. Error bars represent s.e. values. Brain, N=6 normal and 6 glioblastoma; breast, N=3 normal and 3 adenocarcinoma; cervix, N=4 normal and 6 carcinoma; skin, N=2 normal and 2 melanoma.

Similar articles

Cited by

References

    1. Akiri G, Nahari D, Finkelstein Y, Le SY, Elroy-Stein O, Levi BZ (1998) Regulation of vascular endothelial growth factor (VEGF) expression is mediated by internal initiation of translation and alternative initiation of transcription. Oncogene 17: 227–236 - PubMed
    1. Ameri K, Lewis CE, Raida M, Sowter H, Hai T, Harris AL (2004) Anoxic induction of ATF-4 through HIF-1-independent pathways of protein stabilization in human cancer cells. Blood 103: 1876–1882 - PubMed
    1. Bertolotti A, Zhang Y, Hendershot LM, Harding HP, Ron D (2000) Dynamic interaction of BiP and ER stress transducers in the unfolded-protein response. Nat Cell Biol 2: 326–332 - PubMed
    1. Blais JD, Filipenko V, Bi M, Ron D, Koumenis C, Wouters BG, Bell JC (2004) Transcription factor 4 is translationally regulated by hypoxic stress. Mol Cell Biol 24: 7469–7482 - PMC - PubMed
    1. Blouw B, Song H, Tihan T, Bosze J, Ferrara N, Gerber HP, Johnson RS, Bergers G (2003) The hypoxic response of tumors is dependent on their microenvironment. Cancer Cell 4: 133–146 - PubMed

Publication types

MeSH terms