Microarray analyses of gene expression during chondrocyte differentiation identifies novel regulators of hypertrophy
- PMID: 16135533
- PMCID: PMC1266429
- DOI: 10.1091/mbc.e05-01-0084
Microarray analyses of gene expression during chondrocyte differentiation identifies novel regulators of hypertrophy
Abstract
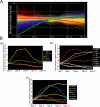
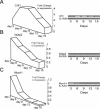
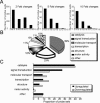
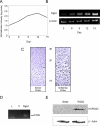
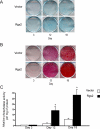
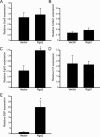
Ordered chondrocyte differentiation and maturation is required for normal skeletal development, but the intracellular pathways regulating this process remain largely unclear. We used Affymetrix microarrays to examine temporal gene expression patterns during chondrogenic differentiation in a mouse micromass culture system. Robust normalization of the data identified 3300 differentially expressed probe sets, which corresponds to 1772, 481, and 249 probe sets exhibiting minimum 2-, 5-, and 10-fold changes over the time period, respectively. GeneOntology annotations for molecular function show changes in the expression of molecules involved in transcriptional regulation and signal transduction among others. The expression of identified markers was confirmed by RT-PCR, and cluster analysis revealed groups of coexpressed transcripts. One gene that was up-regulated at later stages of chondrocyte differentiation was Rgs2. Overexpression of Rgs2 in the chondrogenic cell line ATDC5 resulted in accelerated hypertrophic differentiation, thus providing functional validation of microarray data. Collectively, these analyses provide novel information on the temporal expression of molecules regulating endochondral bone development.
Figures


Similar articles
-
Differential gene expression by Osterix knockdown in mouse chondrogenic ATDC5 cells.Gene. 2013 Apr 15;518(2):368-75. doi: 10.1016/j.gene.2012.12.102. Epub 2013 Jan 19. Gene. 2013. PMID: 23337593
-
Rac1/Cdc42 and RhoA GTPases antagonistically regulate chondrocyte proliferation, hypertrophy, and apoptosis.J Bone Miner Res. 2005 Jun;20(6):1022-31. doi: 10.1359/JBMR.050113. Epub 2005 Jan 31. J Bone Miner Res. 2005. PMID: 15883643
-
Activation of genes for growth factor and cytokine pathways late in chondrogenic differentiation of ATDC5 cells.Genomics. 2006 Jul;88(1):52-64. doi: 10.1016/j.ygeno.2006.02.013. Epub 2006 Apr 4. Genomics. 2006. PMID: 16597497
-
Inhibition of apoptosis signal-regulating kinase 1 enhances endochondral bone formation by increasing chondrocyte survival.Cell Death Dis. 2014 Nov 13;5(11):e1522. doi: 10.1038/cddis.2014.480. Cell Death Dis. 2014. PMID: 25393478 Free PMC article.
-
[Role of BMPs and Smads during endochondral bone formation].Clin Calcium. 2004 Jul;14(7):52-7. Clin Calcium. 2004. PMID: 15577076 Review. Japanese.
Cited by
-
The role of selenium metabolism and selenoproteins in cartilage homeostasis and arthropathies.Exp Mol Med. 2020 Aug;52(8):1198-1208. doi: 10.1038/s12276-020-0408-y. Epub 2020 Aug 13. Exp Mol Med. 2020. PMID: 32788658 Free PMC article. Review.
-
Expression Profile of New Gene Markers Involved in Differentiation of Canine Adipose-Derived Stem Cells into Chondrocytes.Genes (Basel). 2022 Sep 16;13(9):1664. doi: 10.3390/genes13091664. Genes (Basel). 2022. PMID: 36140831 Free PMC article.
-
Maximization of negative correlations in time-course gene expression data for enhancing understanding of molecular pathways.Nucleic Acids Res. 2010 Jan;38(1):e1. doi: 10.1093/nar/gkp822. Epub 2009 Oct 23. Nucleic Acids Res. 2010. PMID: 19854949 Free PMC article.
-
Control of chondrocyte gene expression by actin dynamics: a novel role of cholesterol/Ror-alpha signalling in endochondral bone growth.J Cell Mol Med. 2009 Sep;13(9B):3497-516. doi: 10.1111/j.1582-4934.2009.00684.x. J Cell Mol Med. 2009. PMID: 20196782 Free PMC article.
-
Regulation of gene expression by PI3K in mouse growth plate chondrocytes.PLoS One. 2010 Jan 25;5(1):e8866. doi: 10.1371/journal.pone.0008866. PLoS One. 2010. PMID: 20111593 Free PMC article.
References
-
- Ahrens, P. B., Solursh, M., and Reiter, R. S. (1977). Stage-related capacity for limb chondrogenesis in cell culture. Dev. Biol. 60, 69-82. - PubMed
-
- Al-Shahrour, F., Diaz-Uriarte, R., and Dopazo, J. (2004). FatiGO: a web tool for finding significant associations of gene ontology terms with groups of genes. Bioinformatics 20, 578-580. - PubMed
-
- Alaaeddine, N., Olee, T., Hashimoto, S., Creighton-Achermann, L., and Lotz, M. (2001). Production of the chemokine RANTES by articular chondrocytes and role in cartilage degradation. Arthritis Rheum. 44, 1633-1643. - PubMed
-
- Atsumi, S., Umezawa, K., Iinuma, H., Naganawa, H., Nakamura, H., Iitaka, Y., and Takeuchi, T. (1990). Production, isolation and structure determination of a novel beta-glucosidase inhibitor, cyclophellitol, from Phellinus sp. J. Antibiot. (Tokyo) 43, 49-53. - PubMed
Publication types
MeSH terms
Substances
LinkOut - more resources
Full Text Sources
Other Literature Sources
Molecular Biology Databases

