

Aggregation of granulocyte-colony stimulating factor in vitro involves a conformationally altered monomeric state
- PMID: 16131655
- PMCID: PMC2253479
- DOI: 10.1110/ps.051489405
Aggregation of granulocyte-colony stimulating factor in vitro involves a conformationally altered monomeric state
Abstract
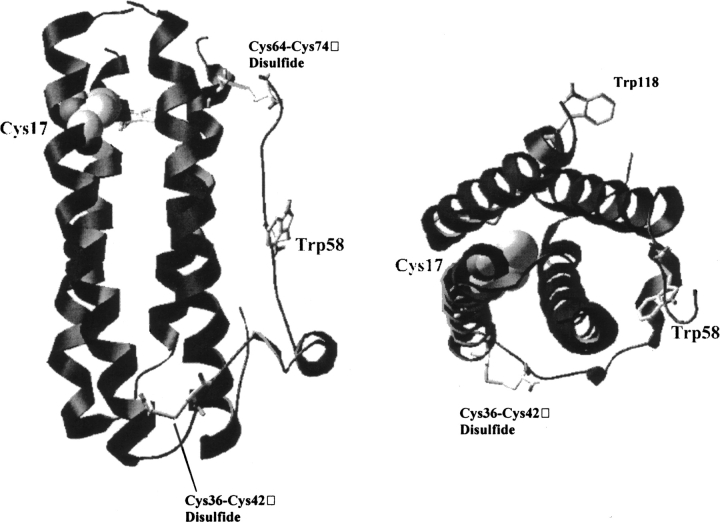
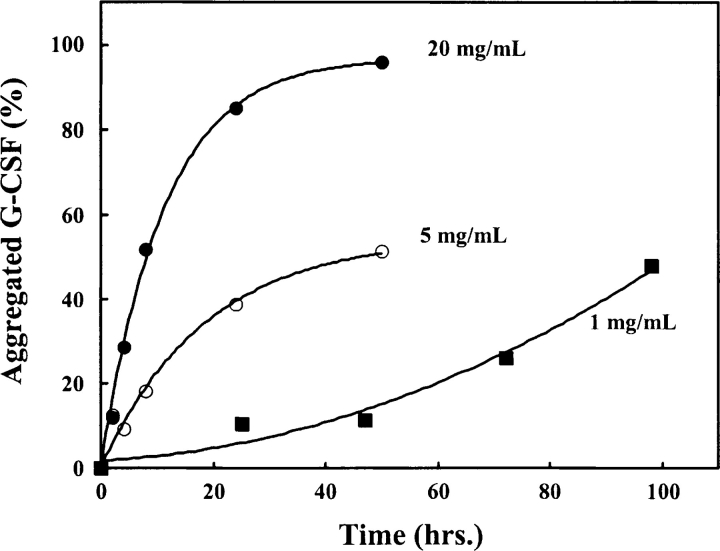
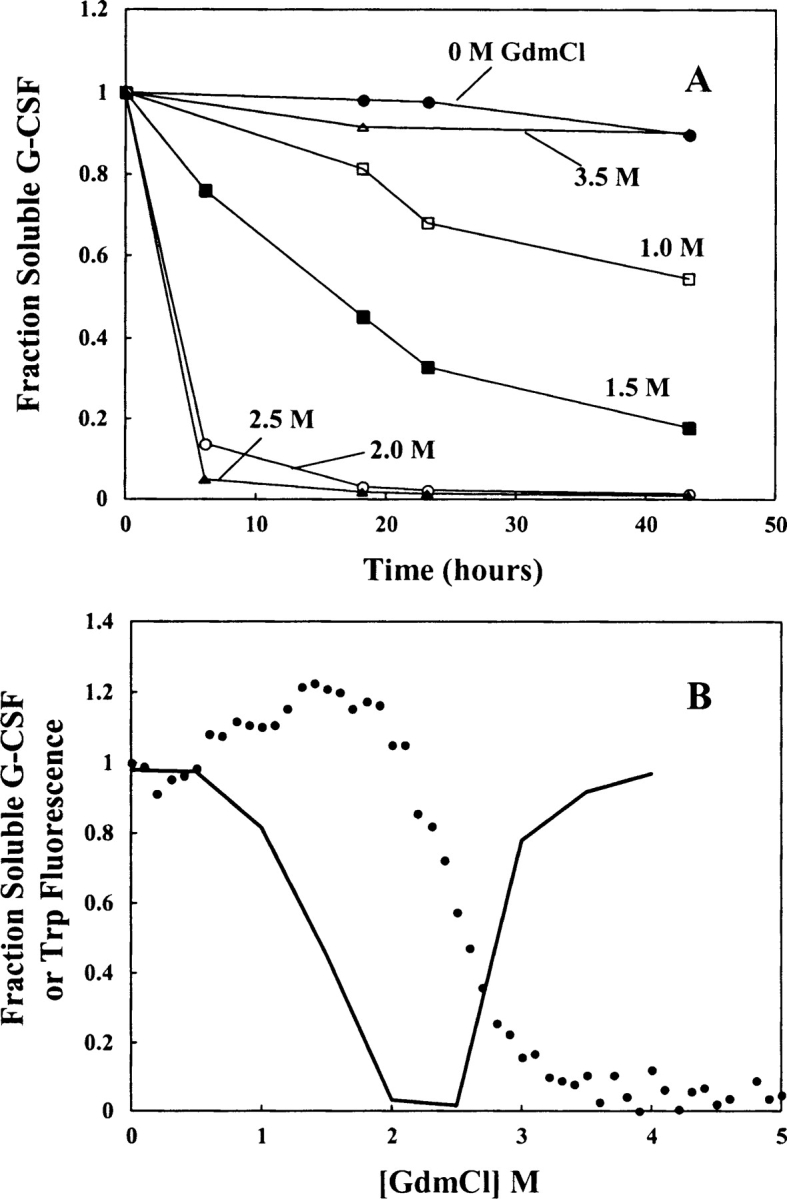
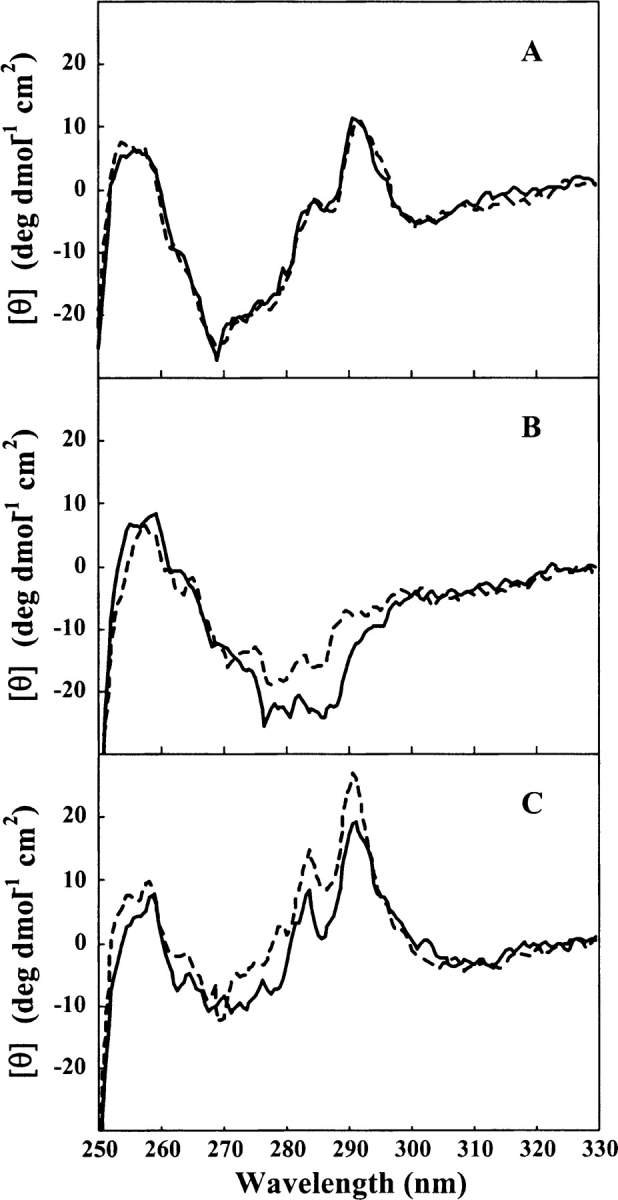
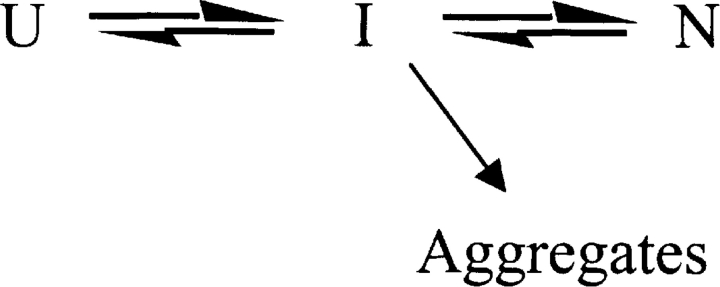
Aggregation of partially folded intermediates populated during protein folding processes has been described for many proteins. Likewise, partially unfolded chains, generated by perturbation of numerous proteins by heat or chemical denaturants, have also been shown to aggregate readily. However, the process of protein aggregation from native-state conditions is less well understood. Granulocyte-colony stimulating factor (G-CSF), a member of the four-helix bundle class of cytokines, is a therapeutically relevant protein involved in stimulating the growth and maturation of phagocytotic white blood cells. Under native-like conditions (37 degrees C [pH 7.0]), G-CSF shows a significant propensity to aggregate. Our data suggest that under these conditions, native G-CSF exists in equilibrium with an altered conformation, which is highly aggregation prone. This species is enriched in 1-2 M GdmCl, as determined by tryptophan fluorescence and increased aggregation kinetics. In particular, specific changes in Trp58 fluorescence report a local rearrangement in the large loop region between helices A and B. However, circular dichroism, reactivity toward cyanylation, and ANS binding demonstrate that this conformational change is subtle, having no substantial disruption of secondary and tertiary structure, reactivity of the free sulfhydryl at Cys17 or exposure of buried hydrophobic regions. There is no indication that this altered conformation is important to biological activity, making it an attractive target for rational protein stabilization.
Figures


Similar articles
-
Granulocyte-colony stimulating factor maintains a thermally stable, compact, partially folded structure at pH2.J Pept Res. 1997 Oct;50(4):310-8. doi: 10.1111/j.1399-3011.1997.tb01472.x. J Pept Res. 1997. PMID: 9352469
-
Conformational changes of recombinant human granulocyte-colony stimulating factor induced by pH and guanidine hydrochloride.J Protein Chem. 1991 Aug;10(4):359-67. doi: 10.1007/BF01025250. J Protein Chem. 1991. PMID: 1723599
-
Folding and oxidation of recombinant human granulocyte colony stimulating factor produced in Escherichia coli. Characterization of the disulfide-reduced intermediates and cysteine----serine analogs.J Biol Chem. 1992 May 5;267(13):8770-7. J Biol Chem. 1992. PMID: 1374379
-
Cysteine 17 of recombinant human granulocyte-colony stimulating factor is partially solvent-exposed.J Protein Chem. 1993 Oct;12(5):525-31. doi: 10.1007/BF01025117. J Protein Chem. 1993. PMID: 7511386
-
Characterization of two fluorescent tryptophans in recombinant human granulocyte-colony stimulating factor: comparison of native sequence protein and tryptophan-deficient mutants.J Protein Chem. 1993 Apr;12(2):229-36. doi: 10.1007/BF01026045. J Protein Chem. 1993. PMID: 7683885
Cited by
-
Nonspecific shielding of unfavorable electrostatic intramolecular interactions in the erythropoietin native-state increase conformational stability and limit non-native aggregation.Protein Sci. 2015 May;24(5):803-11. doi: 10.1002/pro.2651. Epub 2015 Apr 11. Protein Sci. 2015. PMID: 25628168 Free PMC article.
-
The Role of Cyclodextrins against Interface-Induced Denaturation in Pharmaceutical Formulations: A Molecular Dynamics Approach.Mol Pharm. 2021 Jun 7;18(6):2322-2333. doi: 10.1021/acs.molpharmaceut.1c00135. Epub 2021 May 17. Mol Pharm. 2021. PMID: 33999634 Free PMC article.
-
Design Rationale and Development Approach for Pegfilgrastim as a Long-Acting Granulocyte Colony-Stimulating Factor.BioDrugs. 2015 Jun;29(3):185-98. doi: 10.1007/s40259-015-0127-4. BioDrugs. 2015. PMID: 25998211 Free PMC article. Review.
-
Impact of Extractables/Leachables from Filter Materials on the Stability of Protein-Based Pharmaceutical Products.AAPS PharmSciTech. 2022 Aug 24;23(7):233. doi: 10.1208/s12249-022-02374-x. AAPS PharmSciTech. 2022. PMID: 36002610
-
Detection and characterization of altered conformations of protein pharmaceuticals using complementary mass spectrometry-based approaches.Anal Chem. 2008 Oct 1;80(19):7473-81. doi: 10.1021/ac801214x. Epub 2008 Aug 27. Anal Chem. 2008. PMID: 18729476 Free PMC article.
References
-
- Arakawa, T., Prestrelski, S.J., Narhi, L.O., Boone, T.C., and Kenney, W.C. 1993. Cysteine 17 of recombinant human granulocyte-colony stimulating factor is partially solvent-exposed. J. Protein Chem. 12 525–531. - PubMed
-
- Aritomi, M., Kunishima, N., Okamoto, T., Kuroki, R., Ota, Y., and Morikawa, K. 1999. Atomic structure of the GCSF-receptor complex showing a new cytokine-receptor recognition scheme. Nature 401 713–717. - PubMed
-
- Baum, J. and Brodsky, B. 1999. Folding of peptide models of collagen and misfolding in disease. Curr. Opin. Struct. Biol. 9 122–128. - PubMed
-
- ———. 1999. There’s a right way and a wrong way: In vivo and in vitro folding, misfolding and subunit assembly of the P22 tailspike. Structure Fold. Des. 7 R131–R139. - PubMed
Publication types
MeSH terms
Substances
Grants and funding
LinkOut - more resources
Full Text Sources
Other Literature Sources
