

Variation in structural location and amino acid conservation of functional sites in protein domain families
- PMID: 16122386
- PMCID: PMC1215474
- DOI: 10.1186/1471-2105-6-210
Variation in structural location and amino acid conservation of functional sites in protein domain families
Abstract
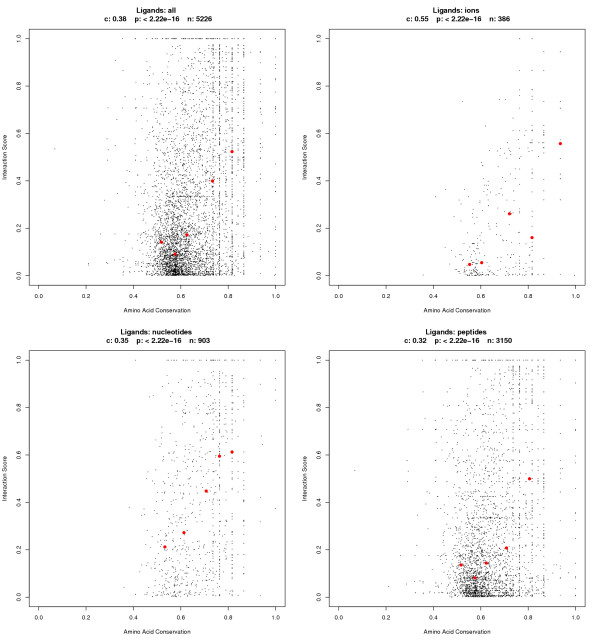
Background: The functional sites of a protein present important information for determining its cellular function and are fundamental in drug design. Accordingly, accurate methods for the prediction of functional sites are of immense value. Most available methods are based on a set of homologous sequences and structural or evolutionary information, and assume that functional sites are more conserved than the average. In the analysis presented here, we have investigated the conservation of location and type of amino acids at functional sites, and compared the behaviour of functional sites between different protein domains.
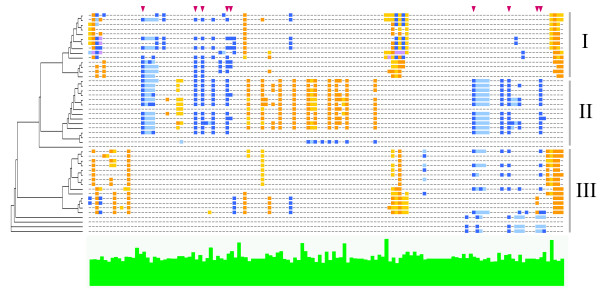
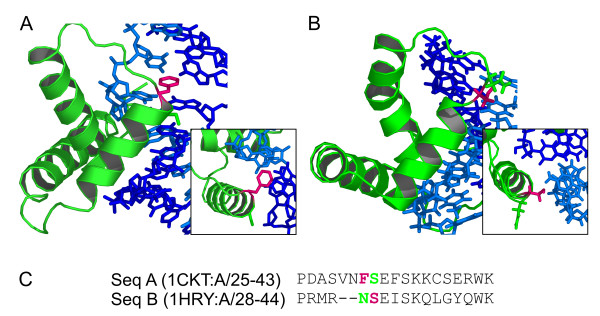
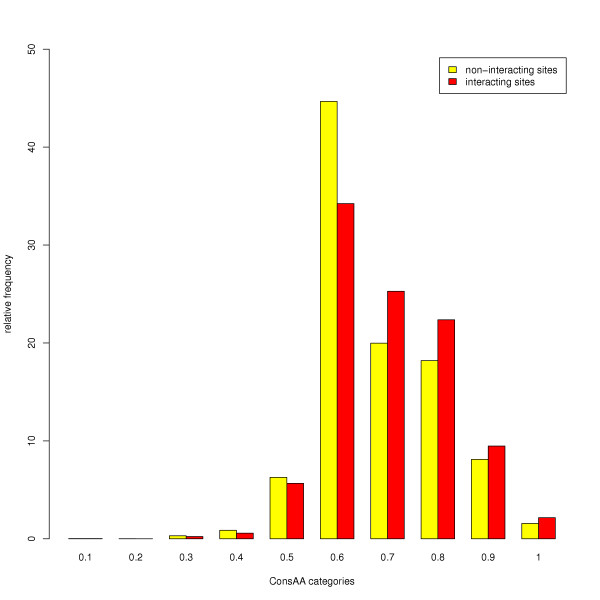
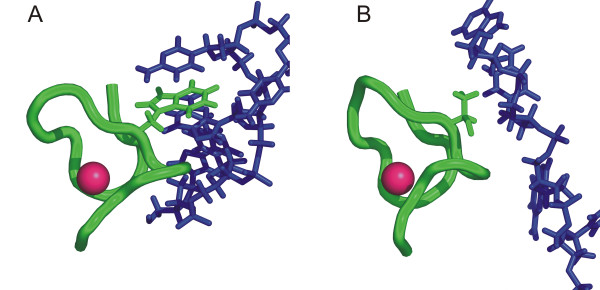
Results: Functional sites were extracted from experimentally determined structural complexes from the Protein Data Bank harbouring a conserved protein domain from the SMART database. In general, functional (i.e. interacting) sites whose location is more highly conserved are also more conserved in their type of amino acid. However, even highly conserved functional sites can present a wide spectrum of amino acids. The degree of conservation strongly depends on the function of the protein domain and ranges from highly conserved in location and amino acid to very variable. Differentiation by binding partner shows that ion binding sites tend to be more conserved than functional sites binding peptides or nucleotides.
Conclusion: The results gained by this analysis will help improve the accuracy of functional site prediction and facilitate the characterization of unknown protein sequences.
Figures

Similar articles
-
Prediction of functional sites by analysis of sequence and structure conservation.Protein Sci. 2004 Apr;13(4):884-92. doi: 10.1110/ps.03465504. Epub 2004 Mar 9. Protein Sci. 2004. PMID: 15010543 Free PMC article.
-
Discarding functional residues from the substitution table improves predictions of active sites within three-dimensional structures.PLoS Comput Biol. 2008 Oct 3;4(10):e1000179. doi: 10.1371/journal.pcbi.1000179. PLoS Comput Biol. 2008. PMID: 18833291 Free PMC article.
-
Sequence and structural analysis of cellular retinoic acid-binding proteins reveals a network of conserved hydrophobic interactions.Proteins. 2004 Feb 1;54(2):179-94. doi: 10.1002/prot.10520. Proteins. 2004. PMID: 14696180
-
Heterotachy and functional shift in protein evolution.IUBMB Life. 2003 Apr-May;55(4-5):257-65. doi: 10.1080/1521654031000123330. IUBMB Life. 2003. PMID: 12880207 Review.
-
Fold change in evolution of protein structures.J Struct Biol. 2001 May-Jun;134(2-3):167-85. doi: 10.1006/jsbi.2001.4335. J Struct Biol. 2001. PMID: 11551177 Review.
Cited by
-
Accuracy of protein-protein binding sites in high-throughput template-based modeling.PLoS Comput Biol. 2010 Apr 1;6(4):e1000727. doi: 10.1371/journal.pcbi.1000727. PLoS Comput Biol. 2010. PMID: 20369011 Free PMC article.
-
The utility of geometrical and chemical restraint information extracted from predicted ligand-binding sites in protein structure refinement.J Struct Biol. 2011 Mar;173(3):558-69. doi: 10.1016/j.jsb.2010.09.009. Epub 2010 Sep 17. J Struct Biol. 2011. PMID: 20850544 Free PMC article.
-
Biophysical characterization and molecular phylogeny of human KIN protein.Eur Biophys J. 2019 Oct;48(7):645-657. doi: 10.1007/s00249-019-01390-3. Epub 2019 Jul 15. Eur Biophys J. 2019. PMID: 31309277
-
In Silico Phylogenetic Analysis and Molecular Modelling Study of 2-Haloalkanoic Acid Dehalogenase Enzymes from Bacterial and Fungal Origin.Adv Bioinformatics. 2016;2016:8701201. doi: 10.1155/2016/8701201. Epub 2016 Jan 6. Adv Bioinformatics. 2016. PMID: 26880911 Free PMC article.
-
Primate protein-ligand interfaces exhibit significant conservation and unveil human-specific evolutionary drivers.PLoS Comput Biol. 2023 Mar 23;19(3):e1010966. doi: 10.1371/journal.pcbi.1010966. eCollection 2023 Mar. PLoS Comput Biol. 2023. PMID: 36952575 Free PMC article.
References
Publication types
MeSH terms
Substances
LinkOut - more resources
Full Text Sources
