

Imaging experimental cerebral malaria in vivo: significant role of ischemic brain edema
- PMID: 16093385
- PMCID: PMC6725296
- DOI: 10.1523/JNEUROSCI.1002-05.2005
Imaging experimental cerebral malaria in vivo: significant role of ischemic brain edema
Abstract
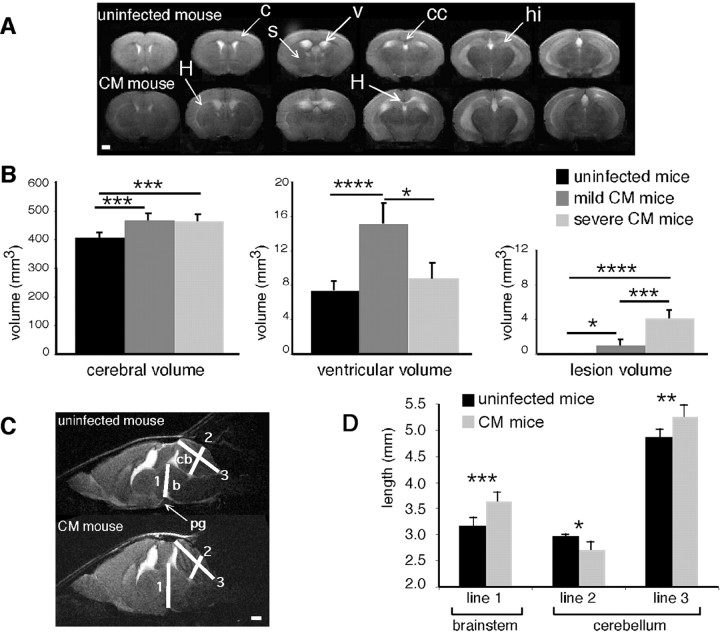
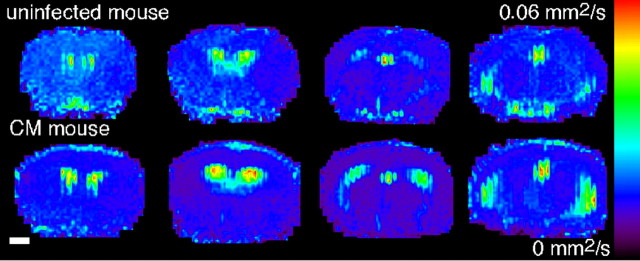
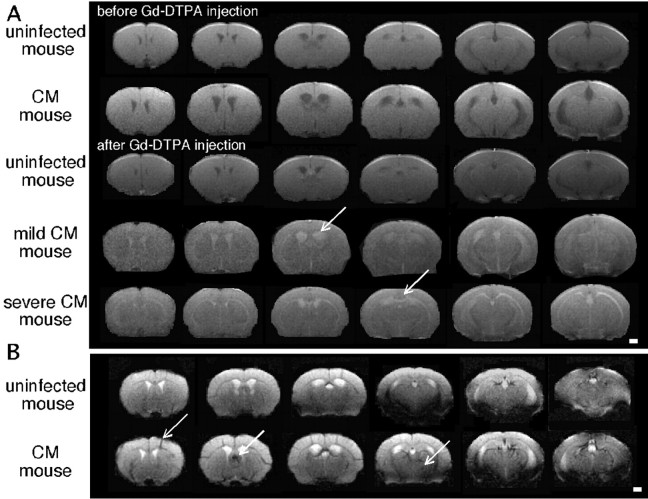
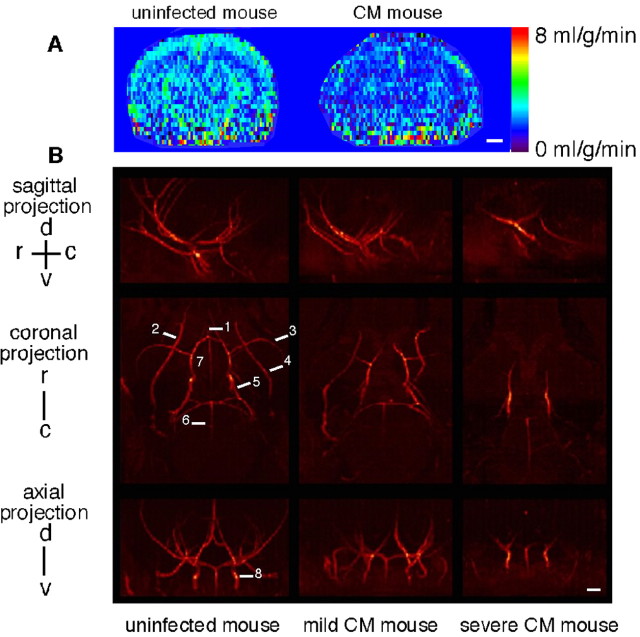
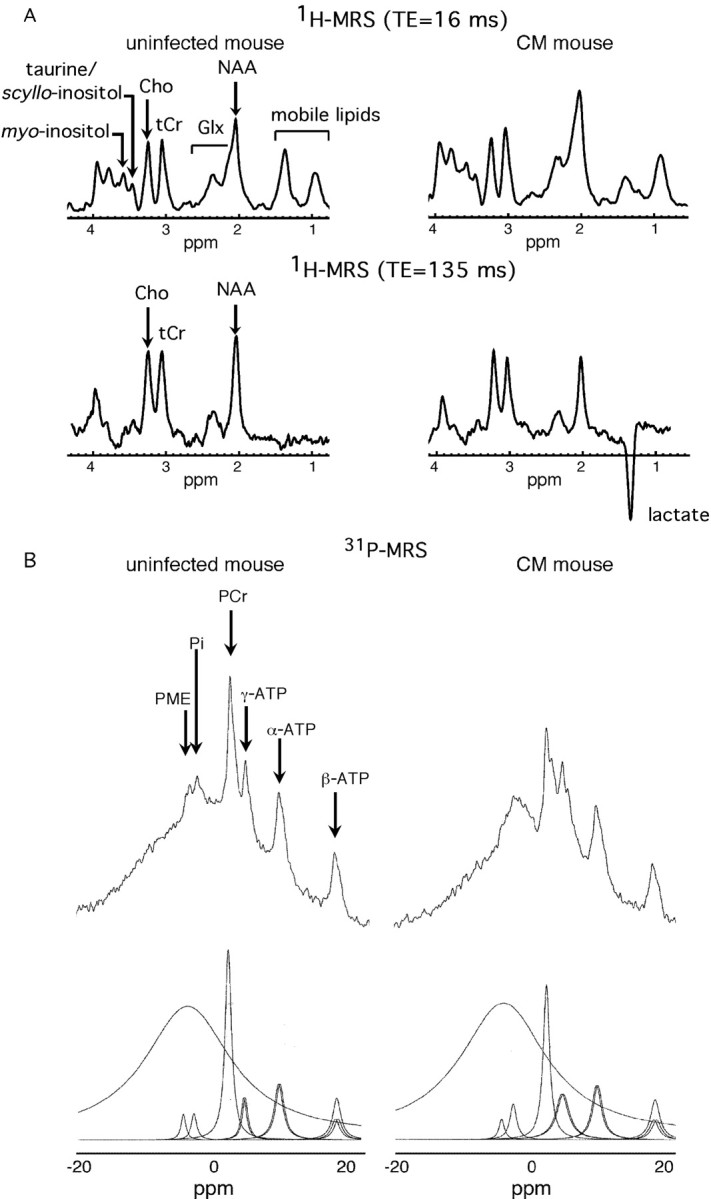
The first in vivo magnetic resonance study of experimental cerebral malaria is presented. Cerebral involvement is a lethal complication of malaria. To explore the brain of susceptible mice infected with Plasmodium berghei ANKA, multimodal magnetic resonance techniques were applied (imaging, diffusion, perfusion, angiography, spectroscopy). They reveal vascular damage including blood-brain barrier disruption and hemorrhages attributable to inflammatory processes. We provide the first in vivo demonstration for blood-brain barrier breakdown in cerebral malaria. Major edema formation as well as reduced brain perfusion was detected and is accompanied by an ischemic metabolic profile with reduction of high-energy phosphates and elevated brain lactate. In addition, angiography supplies compelling evidence for major hemodynamics dysfunction. Actually, edema further worsens ischemia by compressing cerebral arteries, which subsequently leads to a collapse of the blood flow that ultimately represents the cause of death. These findings demonstrate the coexistence of inflammatory and ischemic lesions and prove the preponderant role of edema in the fatal outcome of experimental cerebral malaria. They improve our understanding of the pathogenesis of cerebral malaria and may provide the necessary noninvasive surrogate markers for quantitative monitoring of treatment.
Figures
Similar articles
-
Magnetic resonance spectroscopy reveals an impaired brain metabolic profile in mice resistant to cerebral malaria infected with Plasmodium berghei ANKA.J Biol Chem. 2007 May 11;282(19):14505-14. doi: 10.1074/jbc.M608035200. Epub 2007 Mar 15. J Biol Chem. 2007. PMID: 17369263
-
In the eye of experimental cerebral malaria.Am J Pathol. 2011 Sep;179(3):1104-9. doi: 10.1016/j.ajpath.2011.05.044. Epub 2011 Jul 8. Am J Pathol. 2011. PMID: 21741941 Free PMC article.
-
Perfusion pressure breakthrough threshold of cerebral autoregulation in the chronically ischemic brain: an experimental study in cats.J Neurosurg. 1992 Mar;76(3):478-85. doi: 10.3171/jns.1992.76.3.0478. J Neurosurg. 1992. PMID: 1738030
-
Magnetic resonance imaging during life: the key to unlock cerebral malaria pathogenesis?Malar J. 2014 Jul 18;13:276. doi: 10.1186/1475-2875-13-276. Malar J. 2014. PMID: 25038815 Free PMC article. Review.
-
Changes in brain metabolites in experimental cerebral malaria infection with plasmodium berghei ANKA: a literature review.J Pak Med Assoc. 2014 Oct;64(10):1179-85. J Pak Med Assoc. 2014. PMID: 25823161 Review.
Cited by
-
Anti-plasmodial effects of Azadirachta indica in experimental cerebral malaria: Apoptosis of cerebellar Purkinje cells of mice as a marker.N Am J Med Sci. 2010 Nov;2(11):518-25. doi: 10.4297/najms.2010.2518. N Am J Med Sci. 2010. PMID: 22558559 Free PMC article.
-
A new hypothesis on the manifestation of cerebral malaria: the secret is in the liver.Med Hypotheses. 2013 Nov;81(5):777-83. doi: 10.1016/j.mehy.2013.08.005. Epub 2013 Aug 13. Med Hypotheses. 2013. PMID: 23978689 Free PMC article.
-
Fatal cerebral malaria: a venous efflux problem.Front Cell Infect Microbiol. 2014 Nov 6;4:155. doi: 10.3389/fcimb.2014.00155. eCollection 2014. Front Cell Infect Microbiol. 2014. PMID: 25414834 Free PMC article. Review.
-
Absence of apolipoprotein E protects mice from cerebral malaria.Sci Rep. 2016 Sep 20;6:33615. doi: 10.1038/srep33615. Sci Rep. 2016. PMID: 27647324 Free PMC article.
-
The novel ETA receptor antagonist HJP-272 prevents cerebral microvascular hemorrhage in cerebral malaria and synergistically improves survival in combination with an artemisinin derivative.Life Sci. 2012 Oct 15;91(13-14):687-92. doi: 10.1016/j.lfs.2012.07.006. Epub 2012 Jul 17. Life Sci. 2012. PMID: 22820174 Free PMC article.
References
-
- Adams S, Brown H, Turner G (2002) Breaking down the blood-brain barrier: signaling a path to cerebral malaria? Trends Parasitol 18: 360-366. - PubMed
-
- Arnold DL, Matthews PM, Radda GK (1984) Metabolic recovery after exercise and the assessment of mitochondrial function in vivo in human skeletal muscle by means of 31P NMR. Magn Reson Med 1: 307-315. - PubMed
-
- Ayata C, Ropper AH (2002) Ischaemic brain oedema. J Clin Neurosci 9: 113-124. - PubMed
-
- Bagot S, Idrissa Boubou M, Campino S, Behrschmidt C, Gorgette O, Guenet JL, Penha-Goncalves C, Mazier D, Pied S, Cazenave PA (2002) Susceptibility to experimental cerebral malaria induced by Plasmodium berghei ANKA in inbred mouse strains recently derived from wild stock. Infect Immun 70: 2049-2056. - PMC - PubMed
-
- Ball HJ, MacDougall HG, McGregor IS, Hunt NH (2004) Cyclooxygenase-2 in the pathogenesis of murine cerebral malaria. J Infect Dis 189: 751-758. - PubMed
Publication types
MeSH terms
LinkOut - more resources
Full Text Sources
Other Literature Sources
Medical