

Molecular and cellular barriers limiting the effectiveness of antisense oligonucleotides
- PMID: 16055530
- PMCID: PMC1366730
- DOI: 10.1529/biophysj.104.054080
Molecular and cellular barriers limiting the effectiveness of antisense oligonucleotides
Abstract
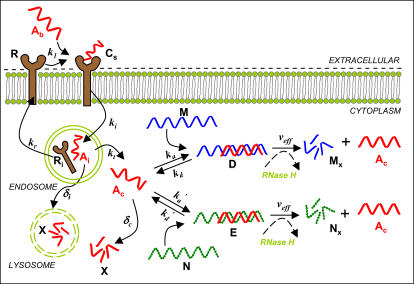
Antisense oligonucleotides present a powerful means to inhibit expression of specific genes, but their effectiveness is limited by factors including cellular delivery, biochemical attack, and poor binding to target. We have developed a systems model of the processes required for an antisense oligonucleotide to enter, gain access to its target mRNA, and exert activity in a cell. The model accurately mimics observed trends in antisense effectiveness with the stability of the oligonucleotide backbone and with the affinity/kinetics of binding to the mRNA over the time course of inhibition. By varying the model parameters within the physically realizable range, we note that the major molecular and cellular barriers to antisense effectiveness are intracellular trafficking, oligonucleotide-mRNA binding rate, and nuclease degradation of oligonucleotides, with a weaker dependence on total cellular uptake than might be expected. Furthermore, the model may serve as a predictive tool to design and test strategies for the cellular use of antisense oligonucleotides. The use of integrated mathematical modeling can play a significant role in the development of antisense and related technologies.
Figures


Similar articles
-
Interplay of polyethyleneimine molecular weight and oligonucleotide backbone chemistry in the dynamics of antisense activity.Nucleic Acids Res. 2007;35(13):4396-408. doi: 10.1093/nar/gkm450. Epub 2007 Jun 18. Nucleic Acids Res. 2007. PMID: 17576672 Free PMC article.
-
A dynamical systems model to simulate the perturbation kinetics of gene expression by antisense oligonucleotides.J Theor Biol. 2001 Mar 7;209(1):103-12. doi: 10.1006/jtbi.2000.2250. J Theor Biol. 2001. PMID: 11237574
-
Modulation of gene expression by antisense and antigene oligodeoxynucleotides and small interfering RNA.Expert Opin Drug Deliv. 2005 Jan;2(1):3-28. doi: 10.1517/17425247.2.1.3. Expert Opin Drug Deliv. 2005. PMID: 16296732 Review.
-
Modified concatemeric oligonucleotide complexes: new system for efficient oligonucleotide transfer into mammalian cells.Hum Gene Ther. 2008 May;19(5):532-46. doi: 10.1089/hum.2007.049. Hum Gene Ther. 2008. PMID: 18457543
-
Antisense oligonucleotides: from design to therapeutic application.Clin Exp Pharmacol Physiol. 2006 May-Jun;33(5-6):533-40. doi: 10.1111/j.1440-1681.2006.04403.x. Clin Exp Pharmacol Physiol. 2006. PMID: 16700890 Review.
Cited by
-
Oligonucleotide loading determines cellular uptake of DNA-modified gold nanoparticles.Nano Lett. 2007 Dec;7(12):3818-21. doi: 10.1021/nl072471q. Epub 2007 Nov 13. Nano Lett. 2007. PMID: 17997588 Free PMC article.
-
Insights into the kinetics of siRNA-mediated gene silencing from live-cell and live-animal bioluminescent imaging.Nucleic Acids Res. 2006 Jan 12;34(1):322-33. doi: 10.1093/nar/gkj439. Print 2006. Nucleic Acids Res. 2006. PMID: 16410612 Free PMC article.
-
Chloroquine and cytosolic galectins affect endosomal escape of antisense oligonucleotides after Stabilin-mediated endocytosis.Mol Ther Nucleic Acids. 2023 Jul 19;33:430-443. doi: 10.1016/j.omtn.2023.07.019. eCollection 2023 Sep 12. Mol Ther Nucleic Acids. 2023. PMID: 37575283 Free PMC article.
-
Poly(propylacrylic acid) enhances cationic lipid-mediated delivery of antisense oligonucleotides.Biomacromolecules. 2006 May;7(5):1502-8. doi: 10.1021/bm060114o. Biomacromolecules. 2006. PMID: 16677032 Free PMC article.
-
Rheological Properties of DNA Molecules in Solution: Molecular Weight and Entanglement Influences.Polymers (Basel). 2016 Aug 3;8(8):279. doi: 10.3390/polym8080279. Polymers (Basel). 2016. PMID: 30974556 Free PMC article.
References
-
- Opalinska, J. B., and A. M. Gewirtz. 2002. Nucleic-acid therapeutics: basic principles and recent applications. Nat. Rev. Drug Discov. 1:503–514. - PubMed
-
- Dean, N. M. 2001. Functional genomics and target validation approaches using antisense oligonucleotide technology. Curr. Opin. Biotechnol. 12:622–625. - PubMed
-
- Taylor, M. F., K. Wiederholt, and F. Sverdrup. 1999. Antisense oligonucleotides: a systematic high-throughput approach to target validation and gene function determination. Drug Discov. Today. 4:562–567. - PubMed
-
- Lee, L. K., and C. M. Roth. 2003. Antisense technology in molecular and cellular bioengineering. Curr. Opin. Biotechnol. 14:505–511. - PubMed
-
- Ramanathan, M., R. D. MacGregor, and C. A. Hunt. 1993. Predictions of effect for intracellular antisense oligodeoxyribonucleotides from a kinetic model. Antisense Res. Dev. 3:3–18. - PubMed
Publication types
MeSH terms
Substances
Grants and funding
LinkOut - more resources
Full Text Sources
