. 2005 Oct;16(10):4852-66.
doi: 10.1091/mbc.e05-05-0398. Epub 2005 Jul 29.

Helicobacter pylori VacA cytotoxin: a probe for a clathrin-independent and Cdc42-dependent pinocytic pathway routed to late endosomes

Affiliations

Helicobacter pylori VacA cytotoxin: a probe for a clathrin-independent and Cdc42-dependent pinocytic pathway routed to late endosomes

Nils C Gauthier et al. Mol Biol Cell. 2005 Oct.

Abstract

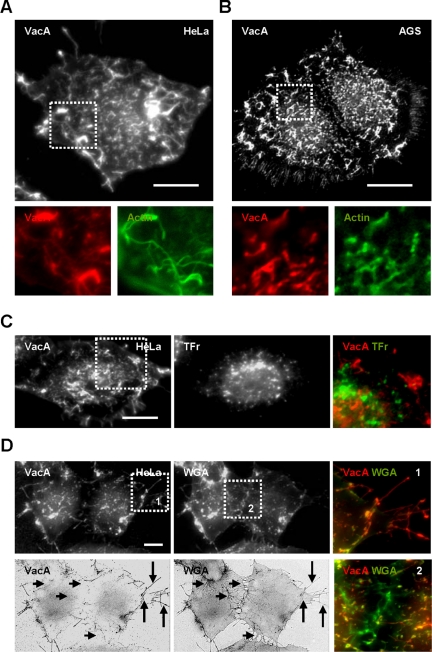
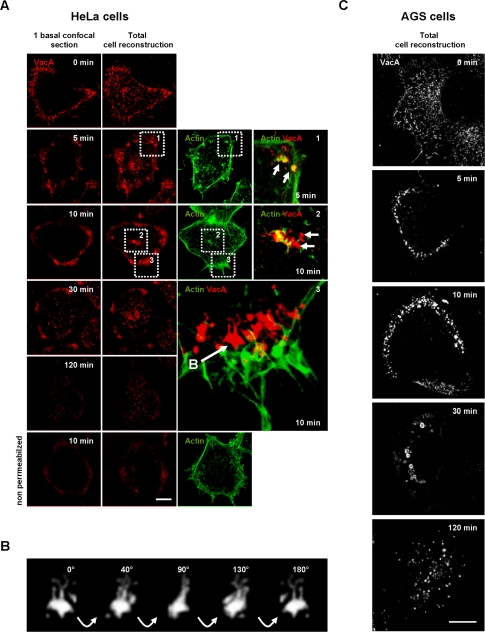
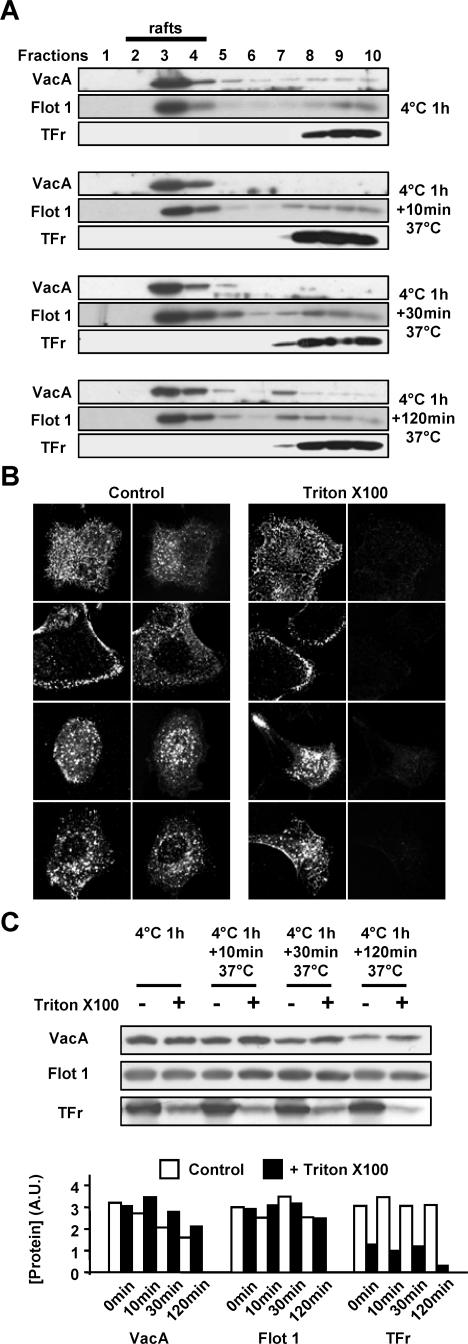
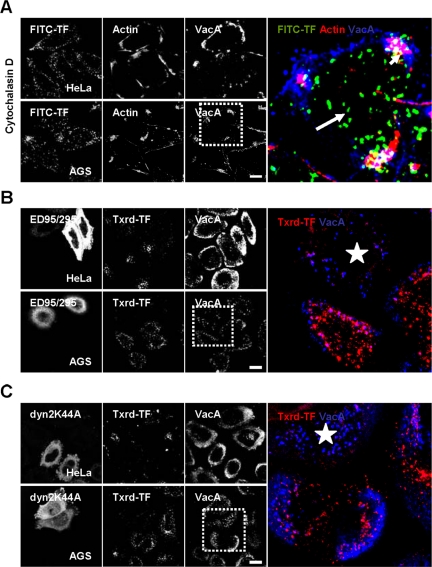
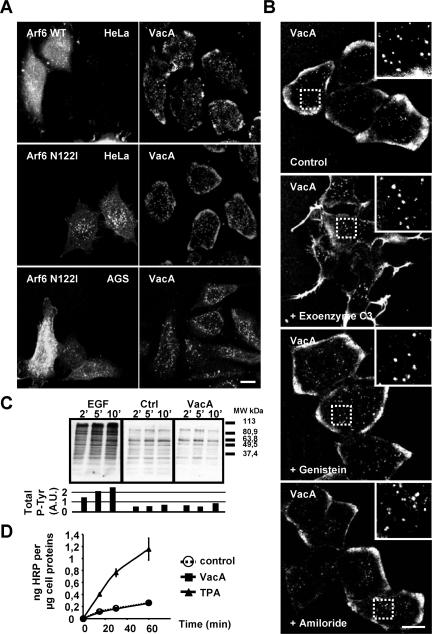
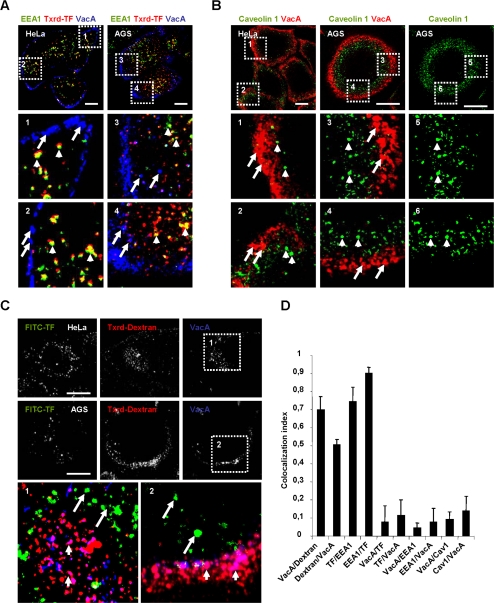
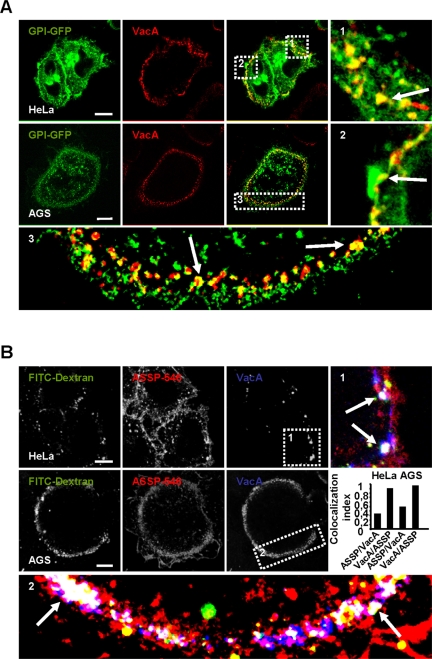
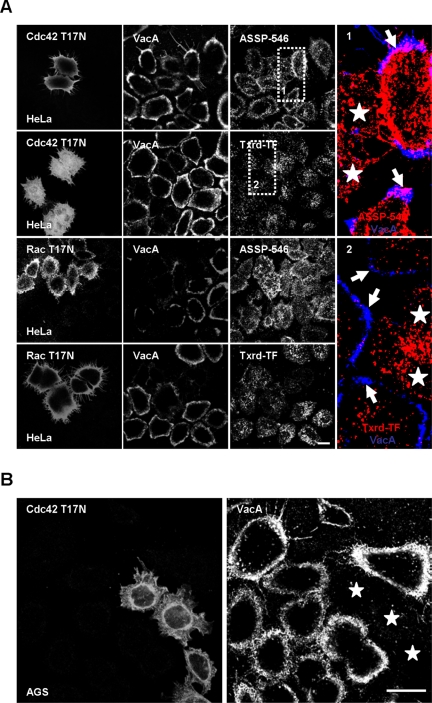
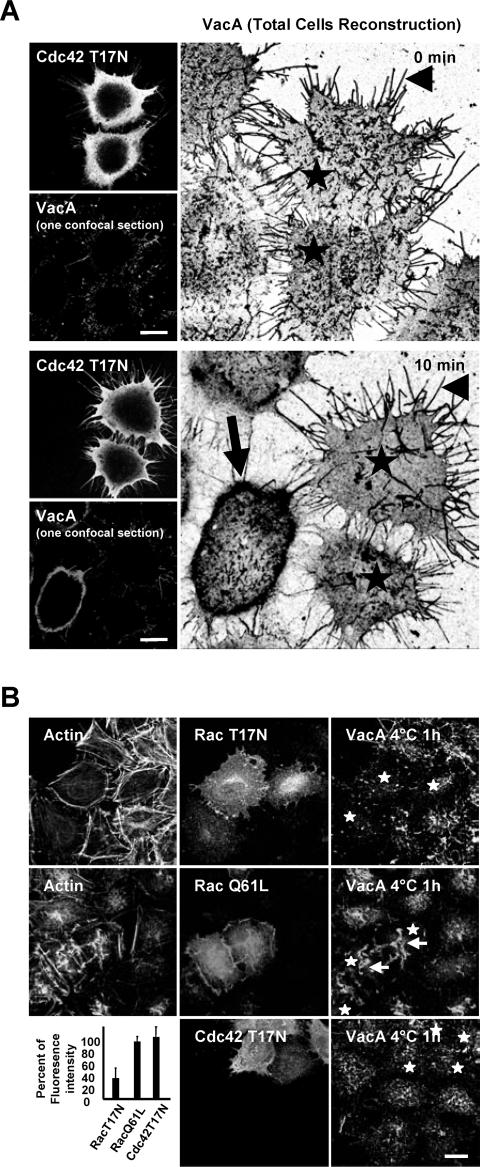
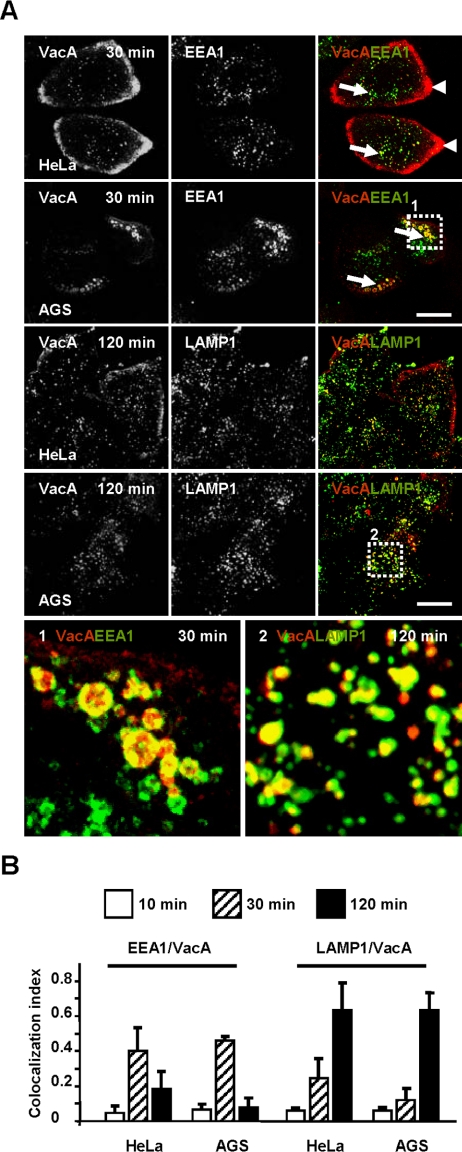
The vacuolating cytotoxin VacA is a major virulence factor of Helicobacter pylori, a bacterium responsible for gastroduodenal ulcers and cancer. VacA associates with lipid rafts, is endocytosed, and reaches the late endocytic compartment where it induces vacuolation. We have investigated the endocytic and intracellular trafficking pathways used by VacA, in HeLa and gastric AGS cells. We report here that VacA was first bound to plasma-membrane domains localized above F-actin structures that were controlled by the Rac1 GTPase. VacA was subsequently pinocytosed by a clathrin-independent mechanism into cell peripheral early endocytic compartments lacking caveolin 1, the Rab5 effector early endosomes antigen-1 (EEA1) and transferrin. These compartments took up fluid-phase (as evidenced by the accumulation of fluorescent dextran) and glycosylphosphatidylinositol-anchored proteins (GPI-APs). VacA pinocytosis was controlled by Cdc42 and did not require cellular tyrosine kinases, dynamin 2, ADP-ribosylating factor 6, or RhoA GTPase activities. VacA was subsequently routed to EEA1-sorting endosomes and then sorted to late endosomes. During all these different endocytic steps, VacA was continuously associated with detergent resistant membrane domains. From these results we propose that VacA might be a valuable probe to study raft-associated molecules, pinocytosed by a clathrin-independent mechanism, and routed to the degradative compartment.


Figures

Figure 1.
Figure 1.
VacA binds membrane domains localized above F-actin structures on the surface of epithelial cells. HeLa cells (A, C, and D) or AGS cells (B) were incubated with VacA at 4°C for 1 h, washed, fixed, and processed for the detection of VacA by 3D-reconstructed indirect immunofluorescence using a video microscope. (A and B) Localization of VacA on membrane domains sustained by F-actin (FITC-phalloidin). VacA is shown alone in black and white in the full size cell pictures and in red in the zooms. Actin is shown in green in the zooms. For A and B see also Supplementary Videos 1 and 2. In C, surface membrane domains containing VacA or transferrin receptor (TFr; zoom, VacA: red, and TFR: green). In D, during the last 15 min of VacA binding at 4°C, cells were incubated with FITC-WGA before fixation in order to detect all cell surface details. The two upper pictures and zooms 1 and 2 represent 3D-reconstructed indirect VacA immunofluorescence or direct FITC-WGA fluorescence of cells. The two lower pictures represent the 2D-deconvoluted VacA and WGA fluorescence (in negative and black and white) of the cells basal plane. VacA is concentrated on certain membrane extensions (long arrows and zoom 1) unlike WGA that binds to the entire cell surface and is also found on retraction fibers observed in cell junctions (short arrows and zoom 2). Scale bars, 10 μm.
Figure 2.
Figure 2.
Time course of VacA endocytosis in HeLa cells. (A) HeLa cells were incubated with VacA at 4°C for 1 h, washed, and incubated for various periods of time at 37°C. Cells (permeabilized or not) were fixed, processed for the detection of VacA immunofluorescence, and observed by confocal microscopy. After 5 min, VacA (red) was concentrated in punctuate fluorescence patterns associated with F-actin (green; zoom 1, arrows: colocalization, between VacA and actin (yellow). After 10 min, VacA started to label tubulovesicular endocytic structures (detected only under permeabilized conditions by contrast to nonpermeabilized cells presented in the bottom row). These compartments are at the top of the cell (zoom 2) or at the cell basal periphery, rear of F-actin structures (zoom 3 and Supplementary Video 3). After 30 min, and moreover after 120 min, VacA was found in vesicular structures scattered throughout the cytosol. (B) Rotation (40° between each frame) in the Y plane of a typical tubulovesicular endocytic structure labeled by VacA (extracted from zoom 3 panel A), reconstructed in 3D (see also Supplementary Video 4). (C) AGS cells were process as for HeLa cells. VacA was localized on membrane protrusions (time 0 min). VacA was then endocytosed in a seemingly polarized manner (times 5 and 10 min) and reached larger endocytic compartments at 30 min. After 120 min, the toxin labeled only smaller vesicular compartments scattered throughout the cytosol. Scale bars, 10 μm.
Figure 3.
Figure 3.
Association of VacA with lipid rafts during endocytosis and intracellular trafficking. (A) AGS cells were incubated with VacA for 1 h at 4°C, washed and warmed for 0, 10, 30, or 120 min at 37°C. For each time point, cells were processed for lipid rafts analysis by flotation gradient after Triton X-100 extraction as described in Materials and Methods. Identification of the proteins in each fractions of the gradient was performed by immunoblots using the IgG 958 for VacA, the MAb anti-flotillin 1 for flotillin 1 (Flot 1; a marker of lipid rafts), and the MAb anti-TFr (as a protein marker excluded from lipid rafts). (B) VacA internalized in endocytic compartments is resistant to Triton X-100 extraction at 4°C by contrast to TFr. AGS cells were incubated with VacA at 4°C for 1 h, washed, and incubated for 0, 10, 30 or 120 min at 37°C. Cells were submitted or not to Triton X-100 extraction at 4°C (as described in Materials and Methods). Cells were fixed, processed for the detection of VacA and TFr by immunofluorescence, and observed by confocal microscopy. All pictures represent total cell reconstructions from confocal sections. Scale bar, 10 μm. (C) VacA, Flot 1, and TFr protein levels associated with control or Triton X-100-extracted AGS cells. The cells were treated as in B except that after Triton X-100 extraction, they were lysed and analyzed by immunoblots as in A. The histogram represents the quantification of the presented immunoblots (arbitrary units: A.U.).
Figure 4.
Figure 4.
VacA endocytosis is an actin-dependent but clathrin- and dynamin 2-independent mechanism. (A) HeLa or AGS cells were treated with cytochalasin D for 60 min and then rinsed. VacA was added for 1 h at 4°C with FITC-TF. Cells were rinsed and incubated at 37°C for 30 min in the presence of cytochalasin D and then washed, fixed, permeabilized, processed for the detection of VacA, transferrin and actin (TRITC-phalloidin) by immunofluorescence, and observed by confocal microscopy. Small arrows in the zoom show that VacA (blue fluorescence) remained at the surface of cytochalasin D-depolymerized F-actin cells (red, short arrows) at difference with transferrin (green, long arrows). (B and C) HeLa and AGS cells were transfected with the dominant-negative form of Eps15 (ED95/295) or with the dominant-negative form of dynamin 2 (Dyn 2 K44A). VacA was added for 1 h at 4°C together with FITC-transferrin. Cells were rinsed and incubated at 37°C for 30 min, washed, fixed, permeabilized, processed for the detection of VacA and transferrin by immunofluorescence, and then observed by confocal microscopy. In the zooms, stars: transfected cells. All pictures were taken from two confocal sections (HeLa) or a total cell reconstruction from confocal sections (AGS). Scale bars, 10 μm.
Figure 5.
Figure 5.
VacA endocytosis does not require Arf6, tyrosine kinase, or RhoA activities, and is different from macropinocytosis. (A) Cells were transfected with the wild-type GFP-Arf6 (Arf6 WT, HeLa cells) or with the dominant negative form of GFP-Arf6 (Arf6 N122I, HeLa and AGS cells). VacA was added for 1 h at 4°C. Cells were rinsed and incubated at 37°C for 30 min, washed, fixed, permeabilized, processed for the detection of VacA and GFP-Arf6 proteins by immunofluorescence, and then observed by confocal microscopy. All pictures represent total cell reconstructions from confocal sections. Scale bar, 10 μm. (B) Treatment of Hela cells with genistein, C3 transferase, or amiloride did not block the endocytosis of VacA. VacA was added to the cells for 1 h at 4°C in each condition (see Materials and Methods). Cells were rinsed and incubated at 37°C for 30 min, washed, fixed, permeabilized, and processed for the detection of VacA, actin, or tyrosine-phosphorylation by immunofluorescence. All pictures represent single confocal sections. Vesicles containing VacA are shown in the zooms for the different conditions. Scale bar, 10 μm. (C) Total P-Tyr analysis in HeLa cells. At time 0, serum-starved cells (18 h) were stimulated with EGF (0,66 μg/ml; EGF), untreated (Ctrl), or intoxicated with VacA (VacA); after 2, 5, or 10 min of treatment at 37°C cells were lysed and analyzed by immunoblotting with a Mab anti-phosphotyrosine. The histogram represents the quantification of the total P-Tyr (arbitrary units: A.U.). (D) Horseradish peroxidase (HRP) uptake of control HeLa cells, of cells treated with 30 nM TPA or of cells treated with VacA. Incubation of cells with HRP and assays for HRP cell internalization and detection were performed as described (Steinman and Cohn, 1972).
Figure 6.
Figure 6.
At an early time point of endocytosis VacA reaches an intracellular compartment containing a fluid phase marker, different from early endosomes or caveosomes. (A) AGS or HeLa cells were incubated with VacA and Txrd-T at 4°C for 1 h, washed, and incubated for 10 min at 37°C. Cells were then fixed, permeabilized, and processed for the detection of VacA (blue), the early endosomal marker EEA1 (green). In zooms 1-4, short arrows: EEA1 and transferrin colocalization and long arrows: VacA-positive vesicles. (B) Cells were processed as in A excepted that Caveolin 1 (green) was detected instead of EEA1 and no transferrin was added to the cells. All pictures were taken from single confocal sections and presented for AGS cells with or without the VacA fluorescence (red). In zooms 1-6 short arrows: caveolin 1-coated structures and long arrows: VacA-positive vesicles. (C) HeLa or AGS cells were incubated with VacA and FITC-TF at 4°C for 1 h, washed, and incubated for 10 min at 37°C with Txrd-dextran (4 mg/ml). Cells were fixed, permeabilized, and processed for the detection of VacA (blue), transferrin (green), and dextran (red) fluorescences. Pictures were taken from full cell reconstructions using confocal sections. In zooms, short arrows: VacA- and dextran-positive vesicles and long arrows: transferrin-positive vesicles. Scale bars, 10 μm. (D) Quantification of colocalizations between endocytic markers by colocalization index in Hela cells. Results represent an account of at least four cells and each column of the histogram is the average of at least four independent experiments.
Figure 7.
Figure 7.
VacA early endocytic compartments contain GPI-APs. (A) HeLa cells or AGS were transfected with GPI-GFP. Cells were incubated at 4°C and VacA was added for 1 h at 4°C. Cells were washed, incubated with VacA in warm medium for 10 min, and then processed for the detection of VacA (red) and GPI-GFP (green) by confocal microscopy. In zooms, arrows indicate the colocalization between VacA and GPI-GFP (yellow). (B) HeLa or AGS cells were incubated at 4°C for 1 h with the pan-GPI-APs marker ASSP-546 and VacA. Cells were washed and incubated in warm medium with FITC-dextran (4 mg/ml) for 10 min and processed for the detection of VacA (blue), ASSP-546 (red), and dextran (green). Arrows in the zooms show the colocalizations (white) between the markers. All pictures in A and B were taken from single confocal sections. Scale bars, 10 μm. The histogram represents the quantification of colocalizations between VacA and ASSP-546 by colocalization index. Results represent the account average for at least 12 cells for each column.
Figure 8.
Figure 8.
VacA internalization into the GEECs is regulated by the Cdc42 GTPase activity. (A) HeLa cells were transfected with the dominant-negative form of Cdc42 (Cdc42 T17N) or by the dominant-negative form of Rac1 (Rac T17N). VacA was added for 1 h at 4°C together with FITC-TF or ASSP-546. Cells were rinsed and incubated at 37°C for 10 min, washed, fixed, permeabilized, processed for the detection of VacA, transferrin, ASSP-546 and the transfected proteins by immunofluorescence, and then observed by confocal microscopy. In the zooms, stars: transfected cells, VacA: blue, ASSP-546 or transferrin: red. Arrows in zooms 1 show colocalizations between ASSP-546 and VacA in the GEECs and arrows in zoom 2 the GEECs in nontransfected cells. All pictures were taken from one confocal section. Scale bar, 10 μm. (B) Identical as in A, but for the effects of the dominant-negative form of Cdc42 only on VacA endocytosis in AGS cells. Stars: transfected cells. Scale bar, 10 μm.
Figure 9.
Figure 9.
The binding of VacA to the cell surface is regulated by Rac1 but not by Cdc42. (A) Association of VacA with Cdc42 T17N transfected cells. HeLa cells were incubated with VacA at 4°C for 1 h, washed, and incubated for 0 or 10 min at 37°C. Cells were fixed, permeabilized, processed for the detection of VacA and Cdc42 T17N immunofluorescences, and observed by confocal microscopy. At 0 min, VacA is associated with membrane extensions (arrowhead) in both control and transfected cells (stars). After 10 min at 37°C, VacA remained mostly associated with the membrane extensions (arrowhead) of Cdc42 T17N-transfected cells (stars) but was clearly internalized in the GEECs in nontransfected cells (arrow). The large pictures show a negative black and white total cell reconstruction. The small pictures show one medial confocal section of the corresponding fields of the large pictures for Cdc42 T17N and VacA fluorescences. (B) HeLa cells were transfected with either the dominant-negative form of Rac1 (Rac T17N), Cdc42 (Cdc42 T17N), or by the dominant-positive form of Rac1 (Rac Q61L). Cells were incubated with VacA for 1 h at 4°C. Cells were washed, fixed, and processed for immunofluorescence of actin, VacA, Rac1, or Cdc42. The pictures were taken from full cell reconstructions using confocal sections. The histogram represents the quantification of VacA fluorescence associated with the whole cell surface. For this purpose cells were reconstructed totally using confocal sections. Each cell area was determined using the fluorescence pattern of F-actin. This area was used to delimit the VacA fluorescence at the surface of each cell. The total fluorescence level of VacA was quantified. The results are expressed as a difference between VacA fluorescence level on transfected cells and that of surrounded untransfected cells (results are express in %, untransfected cells being taken as the 100% for each transfected construction). Quantifications were performed using the Metamorph software. Results represent the account average of three independent experiences. Scale bars, 10 μm.
Figure 10.
Figure 10.
VacA is transferred from the GEECs to EEA1-positive sorting endosomes and subsequently routed to LAMP1-positive vesicles. (A) HeLa cells or AGS cells were incubated with VacA at 4°C for 1 h, washed, and incubated for 30 or 120 min at 37°C. Cells were processed for the detection of VacA (red), EEA1 (green at 30 min), and LAMP1 (green at 120 min), by indirect immunofluorescence. Long arrows: VacA colocalization with sorting early endosome labeled with EEA1 (yellow). Arrowheads: VacA in the GEECs. Zoom 1 shows the detail colocalization of VacA with EEA1-positive endocytic vesicles in AGS cells. Zoom 2 shows the detail colocalization of VacA with LAMP1-positive endocytic vesicles in AGS cells. The images were taken from full-cell reconstructions using confocal sections. Scale bars, 10 μm. (B) Quantification of colocalizations between endocytic markers by colocalization index. Results represent an account of at least six cells and each column of the histogram is the average of at least three independent experiments.

Similar articles

Cited by

References

    1. Adair, W. L., and Kornfeld, S. (1974). Isolation of the receptors for wheat germ agglutinin and the Ricinus communis lectins from human erythrocytes using affinity chromatography. J. Biol. Chem. 249, 4696-4704.
    1. Benmerah, A., Bayrou, M., Cerf-Bensussan, N., and Dautry-Varsat, A. (1999). Inhibition of clathrin-coated pit assembly by an Eps15 mutant. J. Cell Sci. 112, 1303-1311. - PubMed
    1. Blanke, S. R. (2005). Micro-managing the executioner: pathogen targeting of mitochondria. Trends Microbiol. 13, 64-71. - PubMed
    1. Blaser, M. J., and Atherton, J. C. (2004). Helicobacter pylori persistence: biology and disease. J. Clin. Invest. 113, 321-333. - PMC - PubMed
    1. Boquet, P., and Lemichez, E. (2003). Bacterial virulence factors targeting Rho GTPases: parasitism or symbiosis? Trends Cell Biol. 13, 238-246. - PubMed

Publication types

MeSH terms