. 2005 Aug 1;170(3):455-64.
doi: 10.1083/jcb.200503088. Epub 2005 Jul 25.

The p85 regulatory subunit of phosphoinositide 3-kinase down-regulates IRS-1 signaling via the formation of a sequestration complex

Affiliations

The p85 regulatory subunit of phosphoinositide 3-kinase down-regulates IRS-1 signaling via the formation of a sequestration complex

Ji Luo et al. J Cell Biol. .

Abstract

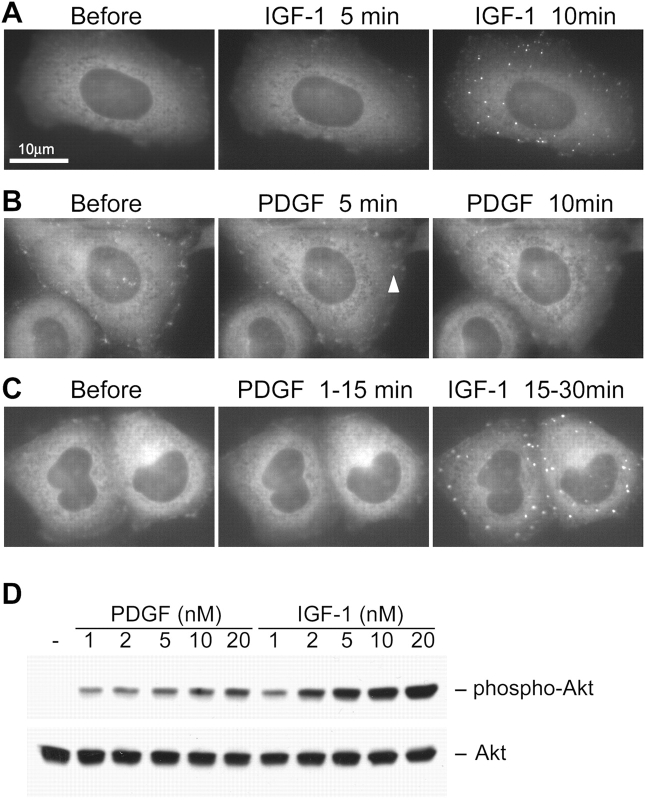
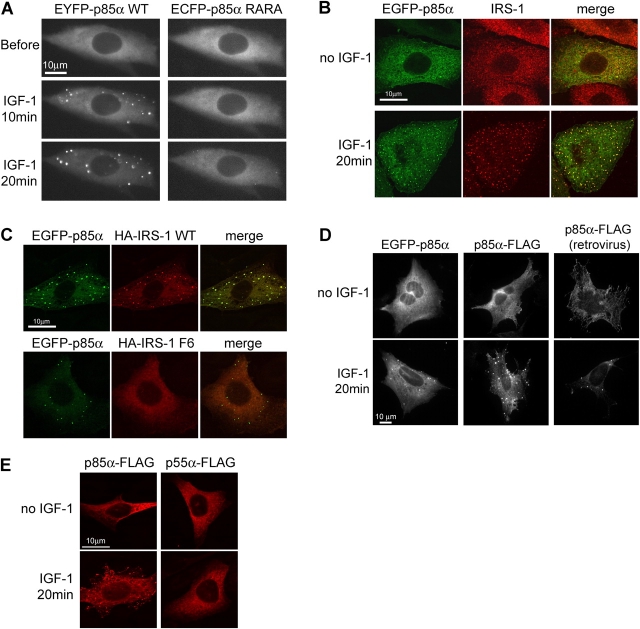
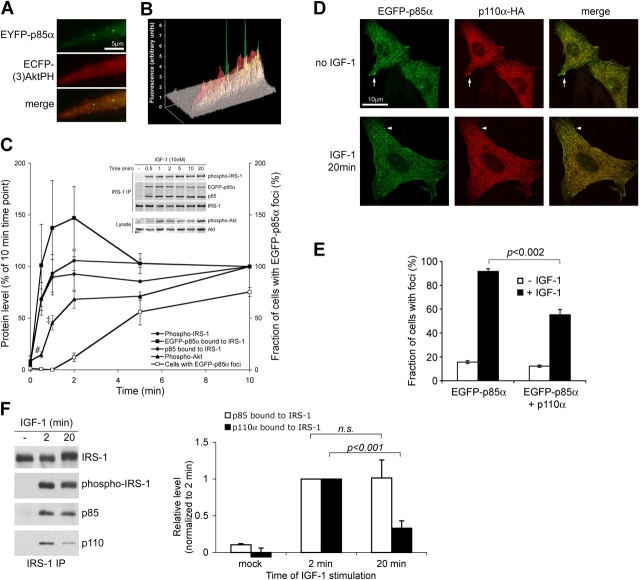
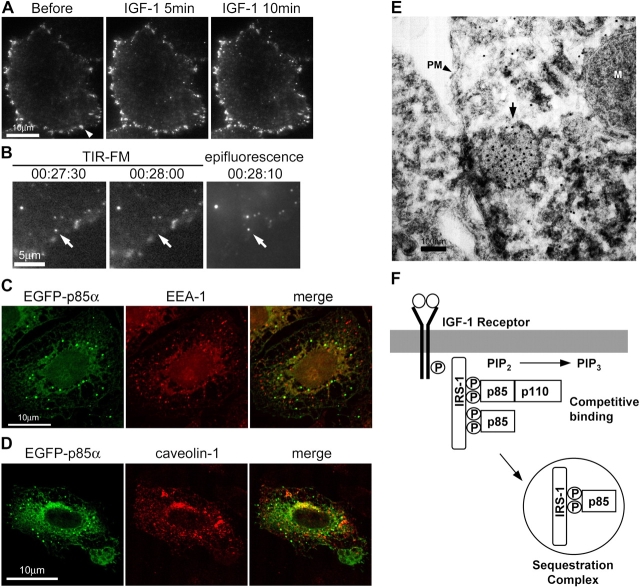
Phosphoinositide (PI) 3-kinase is required for most insulin and insulin-like growth factor (IGF) 1-dependent cellular responses. The p85 regulatory subunit of PI 3-kinase is required to mediate the insulin-dependent recruitment of PI 3-kinase to the plasma membrane, yet mice with reduced p85 expression have increased insulin sensitivity. To further understand the role of p85, we examined IGF-1-dependent translocation of p85alpha by using a green fluorescence protein (GFP)-tagged p85alpha (EGFP-p85alpha). In response to IGF-1, but not to PDGF signaling, EGFP-p85alpha translocates to discrete foci in the cell. These foci contain the insulin receptor substrate (IRS) 1 adaptor molecule, and their formation requires the binding of p85 to IRS-1. Surprisingly, monomeric p85 is preferentially localized to these foci compared with the p85-p110 dimer, and these foci are not sites of phosphatidylinositol-3,4,5-trisphosphate production. Ultrastructural analysis reveals that p85-IRS-1 foci are cytosolic protein complexes devoid of membrane. These results suggest a mechanism of signal down-regulation of IRS-1 that is mediated by monomeric p85 through the formation of a sequestration complex between p85 and IRS-1.


Figures

Figure 1.
Figure 1.
Biochemical characterization of EGFP–p85α reporter constructs. (A) Schematic representation of EGFP–p85α constructs with the domains illustrated (P, proline-rich region). EGFP was fused to the NH2 terminus of p85α. The R/A (arginine to alanine) mutations in the conserved FLVRD/E motif of both SH2 domains of p85α are also indicated. (B) CHO-K1 cells transfected with either the wild-type EGFP–p85α or the SH2 domain mutant. EGFP–p85α RARA (which harbors the R358A and R649A point mutations in the SH2 domains) constructs were serum starved and stimulated with 10 nM IGF-1 for 10 min. The levels of EGFP–p85α and endogenous p85 in total cell lysate, p110α immunoprecipitate, and IRS-1 immunoprecipitate were probed with anti-p85 antibody. (C) CHO-K1 cells cotransfected with HA-Akt and EGFP–p85α or with HA-Akt and EGFP–p85α RARA were serum starved and stimulated with 10 nM IGF-1 for 2 or 20 min. Phosphorylation of HA-Akt was assessed by anti–phospho-Akt threonine-308 Western blot analysis of HA immunoprecipitate. Results shown are representative of two experiments.
Figure 2.
Figure 2.
IGF-1, but not PDGF, induces the translocation of EGFP–p85α to foci. (A–C) CHO-K1 cells stably expressing EGFP–p85α were serum starved and stimulated with 1 nM IGF-1 (A), 20 nM PDGF (B), or first with 20 nM PDGF for 15 min followed by 1 nM IGF-1 for an additional 15 min (C). Cells were imaged live, and frames at indicated time points are shown. Arrowhead indicates PDGF-induced transient EGFP–p85α patches (Videos 1 and 2, available at http://www.jcb.org/cgi/content/full/jcb.200503088/DC1). Results shown are representative of at least five experiments. (D) CHO-K1 cells were serum starved and stimulated with either PDGF or IGF-1 at indicated concentrations for 10 min. Total cell lysates were probed with anti–phospho-Akt serine-473 antibody to assess the level of Akt activation. Results shown are representative of two experiments.
Figure 3.
Figure 3.
EGFP–p85α foci consist of both p85α and IRS-1. (A) CHO-K1 cells cotransfected with wild-type EYFP-p85 and SH2-domain mutant ECFP-p85 RARA were serum starved and stimulated with 10 nM IGF-1. Cells were imaged live in both the yellow and cyan fluorescence channels. Frames at the indicated time points are shown. (B) CHO-K1 cells stably expressing EGFP–p85α were serum starved and stimulated with 10 nM IGF-1 for 20 min. Cells were fixed, and endogenous IRS-1 was visualized with anti–IRS-1 immunofluorescence. (right) Merged image illustrates the colocalization of EGFP–p85α and anti–IRS-1 staining. (C) CHO-K1 cells cotransfected with EGFP–p85α and HA-tagged wild-type IRS-1 or mutant IRS-1–F6 constructs were serum starved and stimulated with 10 nM IGF-1 for 20 min. IRS-1 was visualized with anti-HA immunofluorescence. Results shown are representative of three experiments. (D) p85α2/2p85β2/2 MEFs either transiently expressing EGFP–p85α (left) or p85α-FLAG (middle) or retrovirally expressing p85α-FLAG (right) were starved and stimulated with 10 nM IGF-1 for 20 min. Cells were fixed, and the localization of p85α was either directly visualized (EGFP–p85α) or was visualized by anti-FLAG immunofluorescence (p85α-FLAG). (E) CHO-K1 cells expressing FLAG-tagged p85α or p55α were serum starved and stimulated with 10 nM IGF-1 for 20 min. The localization of p85α-FLAG or p55α-FLAG was visualized by anti-FLAG immunofluorescence. Representative images of two experiments are shown.
Figure 4.
Figure 4.
EGFP–p85α foci are not the sites of PIP3 production. (A) CHO-K1 cells cotransfected with EYFP-p85α and ECFP-(3)AktPH constructs were serum starved and stimulated with 10 nM IGF-1. Cells were imaged live in both the yellow and cyan fluorescence channels. Frames at 10 min post–IGF-1 stimulation are shown. (B) The fluorescence intensity in A was profiled to show the lack of colocalization between the signal of EYFP-p85α (green) and that of ECFP-(3)AktPH (red). Results shown are representative of three experiments. (C) CHO-K1 cells stably expressing EGFP–p85α were serum starved and stimulated with 10 nM IGF-1 for the indicated periods of time. The levels of tyrosine-phosphorylated IRS-1, EGFP–p85α, and p85 that bound to IRS-1 and serine-473–phosphorylated Akt on Western blots were quantified and normalized to their respective levels at the 10-min time point. A representative blot is shown in the inset. At each time point, the percentage of cells that harbor EGFP–p85α foci were also counted. Data represent mean ± SEM of three experiments (#, P < 0.01; ‡, P < 0.08; compared with IRS-1–bound p85 levels at the same time point). (D) CHO-K1 cells cotransfected with EGFP–p85α and HA-tagged p110α were serum starved and stimulated with 10 nM IGF-1 for 20 min. p110α was visualized with anti-HA immunofluorescence. The right panel shows the merged image. Arrow, focal adhesion-like structure; arrowhead, EGFP–p85α focus. Results shown are representative of three experiments. (E) CHO-K1 cells transfected with EGFP–p85α alone or with EGFP–p85α and HA-tagged p110α were serum starved and stimulated with 10 nM IGF-1 for 20 min. The number of transfected cells that also contained EGFP–p85α foci were counted. Results shown are mean ± SEM from three experiments. (F) CHO-K1 cells were serum starved and stimulated with 10 nM IGF-1 for either 2 or 20 min. The levels of endogenous p85 and p110α in IRS-1 immunoprecipitate were assessed by Western blotting (left) and quantified by densitometry (right). The relative levels of p85 and p110α at each time point was calculated by normalizing against their respective values at the 2-min time point. Results shown are mean ± SEM from three experiments.
Figure 5.
Figure 5.
EGFP–p85α foci are intracellular protein complexes. (A) CHO-K1 cells stably expressing EGFP–p85α were serum starved and stimulated with 10 nM IGF-1. Cells were imaged live under TIRFM, and frames of the indicated time points are shown. Arrowhead, focal adhesion-like structure. Results shown are representative of three experiments. (B) Same experiment as in A; the internalization of one of the EGFP–p85α foci (arrow) away from the field of view of TIRFM was captured at the indicated time frames. Thereafter, the illumination was immediately switched from TIRFM to epifluorescence to show that the same spot was still visible under epifluorescence microscopy. (C) CHO-K1 cells stably expressing EGFP–p85α were serum starved and stimulated with IGF-1 for 60 min. Endogenous EEA1 protein was visualized with anti-EEA1 immunofluorescence. Similar results were obtained when cells were stimulated with IGF-1 for 10 or 30 min. Results shown are representative of three experiments. (D) CHO-K1 cells stably expressing EGFP–p85α were serum starved and stimulated with IGF-1 for 10 min. Endogenous caveolin-1 protein was visualized with anti–caveolin-1 immunofluorescence. Similar results were obtained when cells were stimulated with IGF-1 for 30 or 60 min. Results shown are representative of three experiments. (E) CHO-K1 cells stably expressing EGFP–p85α were serum starved and stimulated with IGF-1 for 20 min. EGFP–p85α was immunogold stained and visualized with transmission EM (PM, plasma membrane; M, mitochondrion; arrow, one EGFP–p85α focus). (F) A proposed model of the sequestration of IRS-1 by monomeric p85 as a means to negatively regulate PI 3-kinase signaling. P, phosphorylation on tyrosine residues.

Similar articles

Cited by

References

    1. Alessi, D.R., S.R. James, C.P. Downes, A.B. Holmes, P.R. Gaffney, C.B. Reese, and P. Cohen. 1997. Characterization of a 3-phosphoinositide-dependent protein kinase which phosphorylates and activates protein kinase Balpha. Curr. Biol. 7:261–269. - PubMed
    1. Backer, J.M., M.G. Myers Jr., S.E. Shoelson, D.J. Chin, X.J. Sun, M. Miralpeix, P. Hu, B. Margolis, E.Y. Skolnik, J. Schlessinger, et al. 1992. Phosphatidylinositol 3′-kinase is activated by association with IRS-1 during insulin stimulation. EMBO J. 11:3469–3479. - PMC - PubMed
    1. Barbour, L.A., J. Shao, L. Qiao, W. Leitner, M. Anderson, J.E. Friedman, and B. Draznin. 2004. Human placental growth hormone increases expression of the p85 regulatory unit of phosphatidylinositol 3-kinase and triggers severe insulin resistance in skeletal muscle. Endocrinology. 145:1144–1150. - PubMed
    1. Brachmann, S.M., K. Ueki, J.A. Engelman, R.C. Kahn, and L.C. Cantley. 2005. a. Phosphoinositide 3-kinase catalytic subunit deletion and regulatory subunit deletion have opposite effects on insulin sensitivity in mice. Mol. Cell. Biol. 25:1596–1607. - PMC - PubMed
    1. Brachmann, S.M., C.M. Yballe, M. Innocenti, J.A. Deane, D.A. Fruman, S.M. Thomas, and L.C. Cantley. 2005. b. Role of phosphoinositide 3-kinase regulatory isoforms in development and actin rearrangement. Mol. Cell. Biol. 25:2593–2606. - PMC - PubMed

Publication types

MeSH terms