

Sibship T2 association tests of complex diseases for tightly linked markers
- PMID: 16004725
- PMCID: PMC3530186
- DOI: 10.1186/1479-7364-2-2-90
Sibship T2 association tests of complex diseases for tightly linked markers
Abstract
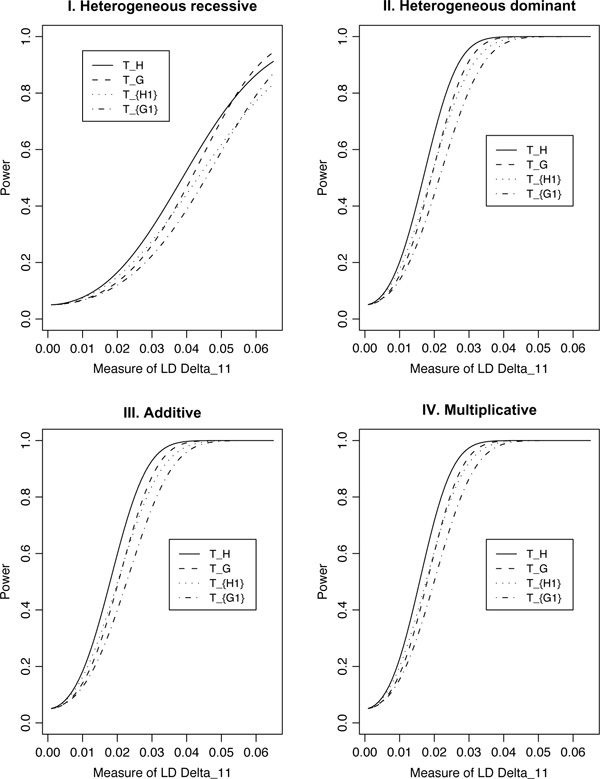
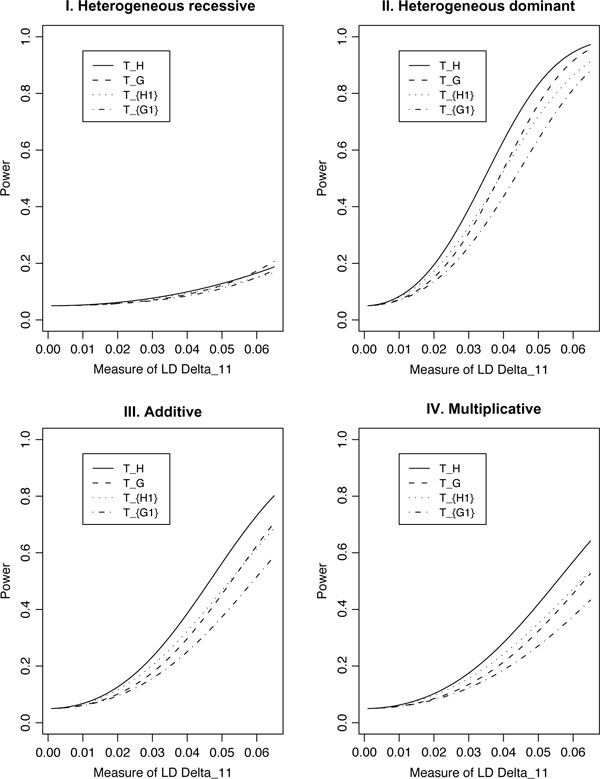
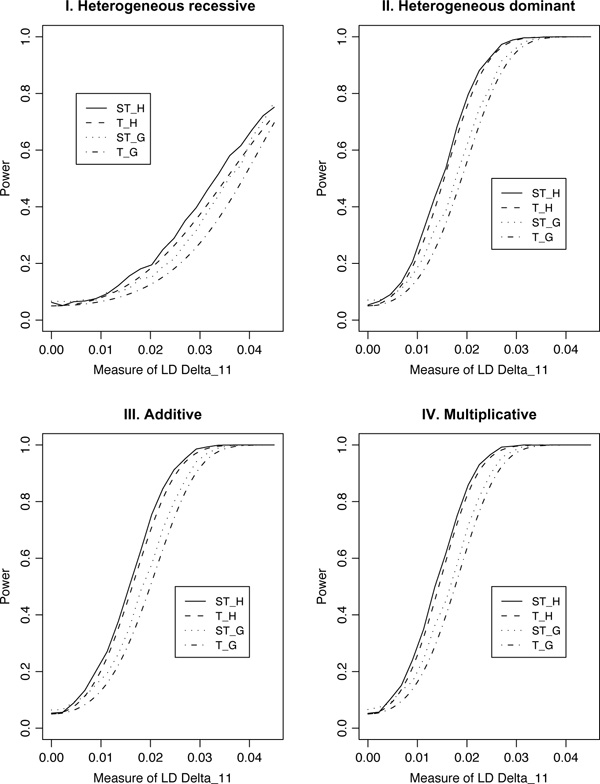
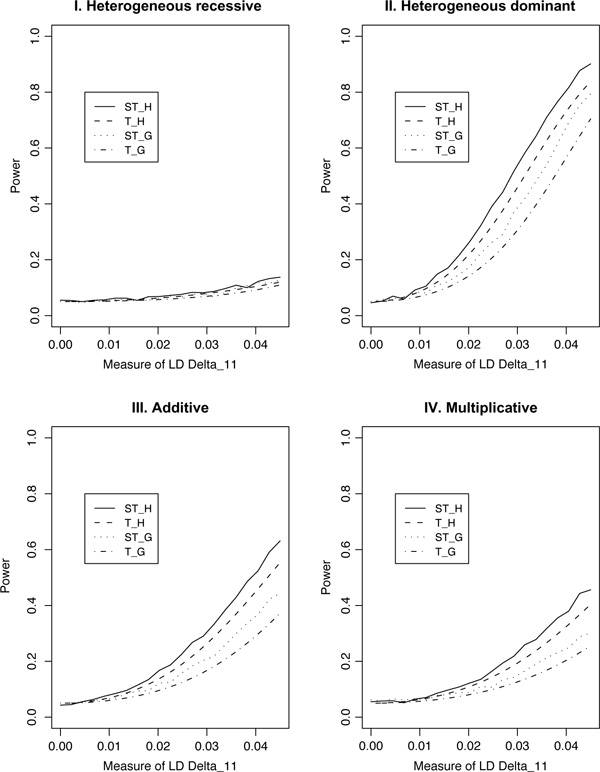
For population case-control association studies, the false-positive rates can be high due to inappropriate controls, which can occur if there is population admixture or stratification. Moreover, it is not always clear how to choose appropriate controls. Alternatively, the parents or normal sibs can be used as controls of affected sibs. For late-onset complex diseases, parental data are not usually available. One way to study late-onset disorders is to perform sib-pair or sibship analyses. This paper proposes sibship-based Hotelling's T2 test statistics for high-resolution linkage disequilibrium mapping of complex diseases. For a sample of sibships, suppose that each sibship consists of at least one affected sib and at least one normal sib. Assume that genotype data of multiple tightly linked markers/haplotypes are available for each individual in the sample. Paired Hotelling's T2 test statistics are proposed for high-resolution association studies using normal sibs as controls for affected sibs, based on two coding methods: 'haplotype/allele coding' and 'genotype coding'. The paired Hotelling's T2 tests take into account not only the correlation among the markers, but also take the correlation within each sib-pair. The validity of the proposed method is justified by rigorous mathematical and statistical proofs under the large sample theory. The non-centrality parameter approximations of the test statistics are calculated for power and sample size calculations. By carrying out power and simulation studies, it was found that the non-centrality parameter approximations of the test statistics were accurate. By power and type I error analysis, the test statistics based on the 'haplotype/allele coding' method were found to be advantageous in comparison to the test statistics based on the 'genotype coding' method. The test statistics based on multiple markers can have higher power than those based on a single marker. The test statistics can be applied not only for bi-allelic markers, but also for multi-allelic markers. In addition, the test statistics can be applied to analyse the genetic data of multiple markers which contain double heterozygotes--that is, unknown linkage phase data. An SAS macro, Hotel_sibs.sas, is written to implement the method for data analysis.
Figures
Similar articles
-
High resolution T association tests of complex diseases based on family data.Ann Hum Genet. 2005 Mar;69(Pt 2):187-208. doi: 10.1046/j.1529-8817.2004.00151.x. Ann Hum Genet. 2005. PMID: 15720300
-
Genome association studies of complex diseases by case-control designs.Am J Hum Genet. 2003 Apr;72(4):850-68. doi: 10.1086/373966. Epub 2003 Mar 19. Am J Hum Genet. 2003. PMID: 12647259 Free PMC article.
-
A discordant-sibship test for disequilibrium and linkage: no need for parental data.Am J Hum Genet. 1998 Dec;63(6):1886-97. doi: 10.1086/302137. Am J Hum Genet. 1998. PMID: 9837840 Free PMC article.
-
The relative power of family-based and case-control designs for linkage disequilibrium studies of complex human diseases I. DNA pooling.Genome Res. 1998 Dec;8(12):1273-88. doi: 10.1101/gr.8.12.1273. Genome Res. 1998. PMID: 9872982 Review.
-
Non-replication of association studies: "pseudo-failures" to replicate?Genet Med. 2007 Jun;9(6):325-31. doi: 10.1097/gim.0b013e3180676d79. Genet Med. 2007. PMID: 17575498 Review.
Cited by
-
Improving power in genetic-association studies via wavelet transformation.BMC Genet. 2009 Sep 11;10:53. doi: 10.1186/1471-2156-10-53. BMC Genet. 2009. PMID: 19747393 Free PMC article.
References
-
- Botstein D, Risch N. Discovering genotypes underlying human phenotypes: Past successes for Mendelian disease, future approaches for complex disease. Nat Genet. 2003;33(Suppl):228–237. - PubMed
Publication types
MeSH terms
Substances
LinkOut - more resources
Full Text Sources
