

Profile and analysis of gene expression changes during early development in germinating spores of Ceratopteris richardii
- PMID: 15965014
- PMCID: PMC1176442
- DOI: 10.1104/pp.105.062851
Profile and analysis of gene expression changes during early development in germinating spores of Ceratopteris richardii
Abstract
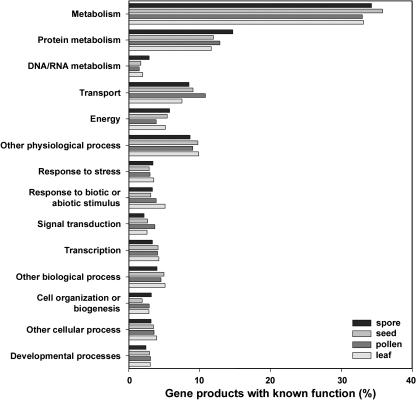
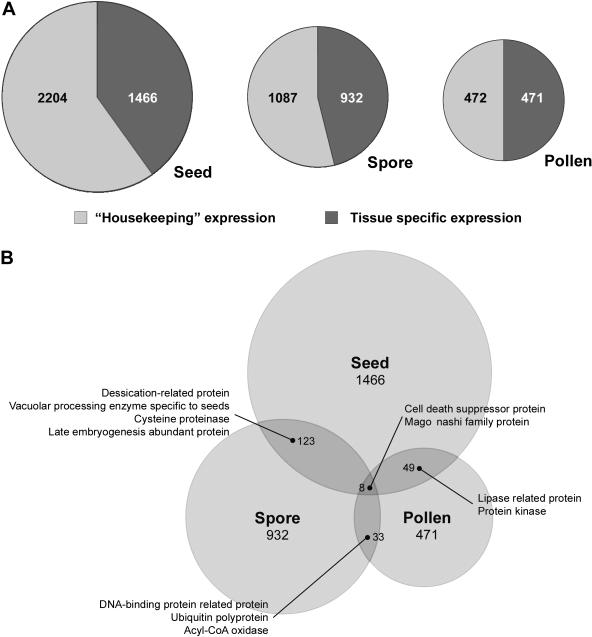
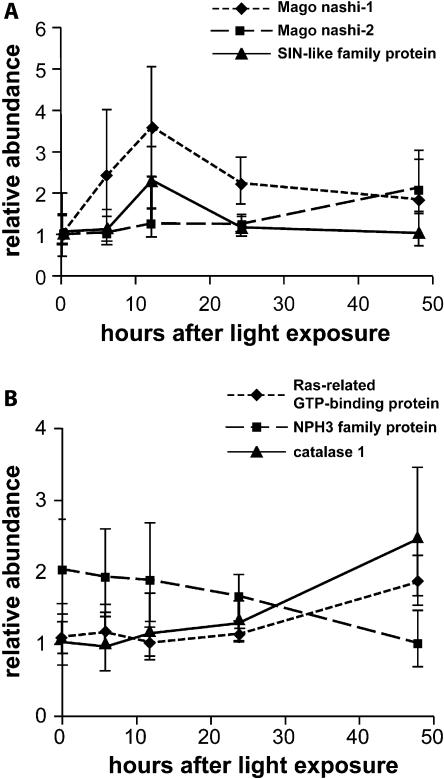
Analysis of an expressed sequence tag library with more than 5,000 sequences from spores of the fern Ceratopteris richardii reveals that more than 3,900 of them represent distinct genes, and almost 70% of these have significant similarity to Arabidopsis (Arabidopsis thaliana) genes. Eight genes are common between three very different dormant plant systems, Ceratopteris spores, Arabidopsis seeds, and Arabidopsis pollen. We evaluated the pattern of mRNA abundance over the first 48 h of spore development using a microarray of cDNAs representing 3,207 distinct genes of C. richardii and determined the relative levels of RNA abundance for 3,143 of these genes using a Bayesian method of statistical analysis. More than 900 of them (29%) show a significant change between any of the five time points analyzed, and these have been annotated based on their sequence similarity with the Arabidopsis proteome. Novel data arising from these analyses identify genes likely to be critical for the germination and subsequent early development of diverse cells and tissues emerging from dormancy.
Figures

Similar articles
-
Gene expression changes induced by space flight in single-cells of the fern Ceratopteris richardii.Planta. 2008 Dec;229(1):151-9. doi: 10.1007/s00425-008-0817-y. Epub 2008 Sep 20. Planta. 2008. PMID: 18807069
-
Temporal expression patterns of hormone metabolism genes during imbibition of Arabidopsis thaliana seeds: a comparative study on dormant and non-dormant accessions.Plant Cell Physiol. 2009 Oct;50(10):1786-800. doi: 10.1093/pcp/pcp121. Epub 2009 Aug 27. Plant Cell Physiol. 2009. PMID: 19713425
-
Ceratopteris richardii: a productive model for revealing secrets of signaling and development.J Plant Growth Regul. 2000 Sep;19(3):284-9. doi: 10.1007/s003440000032. J Plant Growth Regul. 2000. PMID: 11725792
-
Gene expression associated with apogamy commitment in Ceratopteris richardii.Sex Plant Reprod. 2012 Dec;25(4):293-304. doi: 10.1007/s00497-012-0198-z. Epub 2012 Sep 25. Sex Plant Reprod. 2012. PMID: 23007856
-
KNOX homeobox genes potentially have similar function in both diploid unicellular and multicellular meristems, but not in haploid meristems.Evol Dev. 2005 Jan-Feb;7(1):69-78. doi: 10.1111/j.1525-142X.2005.05008.x. Evol Dev. 2005. PMID: 15642091 Review.
Cited by
-
How many genes are needed to make a pollen tube? Lessons from transcriptomics.Ann Bot. 2007 Dec;100(6):1117-23. doi: 10.1093/aob/mcm208. Ann Bot. 2007. PMID: 17951360 Free PMC article.
-
De novo characterization of the gametophyte transcriptome in bracken fern, Pteridium aquilinum.BMC Genomics. 2011 Feb 8;12:99. doi: 10.1186/1471-2164-12-99. BMC Genomics. 2011. PMID: 21303537 Free PMC article.
-
Cytological and Proteomic Analyses of Osmunda cinnamomea Germinating Spores Reveal Characteristics of Fern Spore Germination and Rhizoid Tip Growth.Mol Cell Proteomics. 2015 Sep;14(9):2510-34. doi: 10.1074/mcp.M114.047225. Epub 2015 Jun 19. Mol Cell Proteomics. 2015. PMID: 26091698 Free PMC article.
-
The fern as a model system to study photomorphogenesis.J Plant Res. 2007 Jan;120(1):3-16. doi: 10.1007/s10265-006-0064-x. Epub 2007 Jan 25. J Plant Res. 2007. PMID: 17252173 Review.
-
Ceratopteris richardii (C-fern): a model for investigating adaptive modification of vascular plant cell walls.Front Plant Sci. 2013 Sep 23;4:367. doi: 10.3389/fpls.2013.00367. eCollection 2013. Front Plant Sci. 2013. PMID: 24065974 Free PMC article.
References
-
- Banks JA (1999) Gametophyte development in ferns. Annu Rev Plant Physiol Plant Mol Biol 50: 163–186 - PubMed
-
- Brazma A, Hingamp P, Quackenbush J, Sherlock G, Spellman P, Stoeckert C, Aach J, Ansorge W, Ball CA, Causton HC, et al (2001) Minimum information about a microarray experiment (MIAME)-toward standards for microarray data. Nat Genet 29: 365–371 - PubMed
-
- Brose U, Martinez ND, Williams RJ (2003) Estimating species richness: sensitivity to sample coverage and insensitivity to spatial patterns. Ecology 84: 2364–2377
Publication types
MeSH terms
Substances
LinkOut - more resources
Full Text Sources
Molecular Biology Databases
