

Negative feedback regulation among SR splicing factors encoded by Rbp1 and Rbp1-like in Drosophila
- PMID: 15961996
- PMCID: PMC1176452
- DOI: 10.1038/sj.emboj.7600723
Negative feedback regulation among SR splicing factors encoded by Rbp1 and Rbp1-like in Drosophila
Abstract
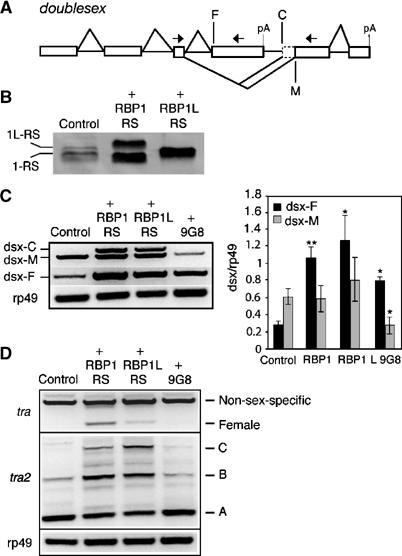
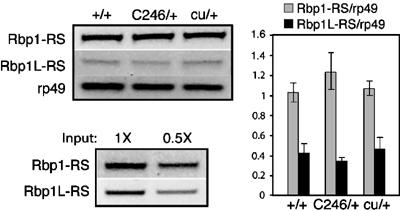
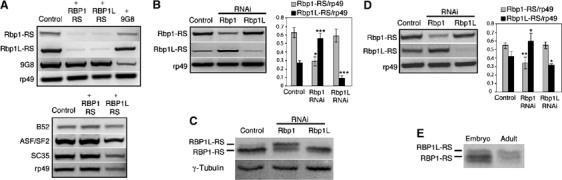
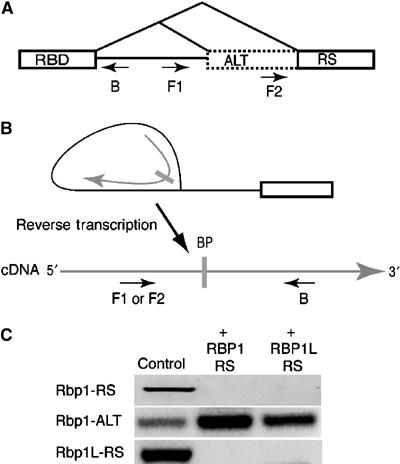
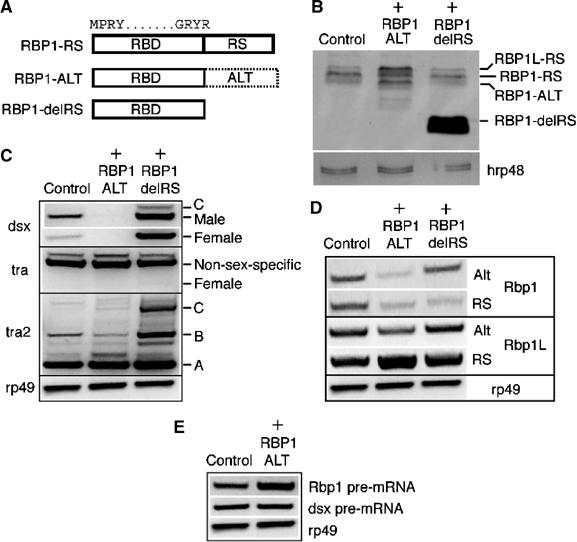
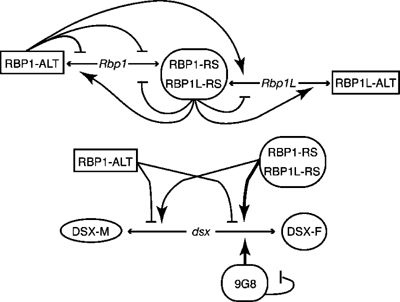
SR proteins constitute a widely conserved family of splicing regulators. Negative autoregulation of SR proteins has been proposed to exert homeostatic control on the splicing environment, but few examples have been studied and the role of isoforms that lack the RS domain is unclear. We show that genes Rbp1 and Rbp1-like, which encode Drosophila homologs of mammalian SRp20, negatively autoregulate and crossregulate at the level of alternative 3' splice site selection. This adjusts the relative expression of isoforms with either an RS domain or unrelated C-terminal domains (ALT) that are rich in serine and threonine. The effects of RBP1-ALT on splicing of doublesex and Rbp1-like are opposite to those of RBP1-RS and RBP1L-RS. RBP1-ALT and -RS exert opposing negative feedback on the ALT/RS ratio. However, RBP1-ALT inhibits the expression of RBP1-RS while stimulating that of RBP1L-RS. This asymmetry may contribute to changes in the RBP1-RS/RBP1L-RS ratio that are observed during development. These results provide the first example of a feedback-regulated SR protein network with evidence of an active homeostatic role for alternative isoforms.
Figures

Similar articles
-
The Drosophila SR protein RBP1 contributes to the regulation of doublesex alternative splicing by recognizing RBP1 RNA target sequences.EMBO J. 1995 Aug 15;14(16):3987-4000. doi: 10.1002/j.1460-2075.1995.tb00070.x. EMBO J. 1995. PMID: 7664738 Free PMC article.
-
In vivo analysis of the functional domains of the Drosophila splicing regulator RBP1.Proc Natl Acad Sci U S A. 1997 Jan 7;94(1):115-20. doi: 10.1073/pnas.94.1.115. Proc Natl Acad Sci U S A. 1997. PMID: 8990170 Free PMC article.
-
The Drosophila RNA-binding protein RBP1 is localized to transcriptionally active sites of chromosomes and shows a functional similarity to human splicing factor ASF/SF2.Genes Dev. 1992 Dec;6(12B):2569-79. doi: 10.1101/gad.6.12b.2569. Genes Dev. 1992. PMID: 1340470
-
SR proteins and related factors in alternative splicing.Adv Exp Med Biol. 2007;623:107-22. doi: 10.1007/978-0-387-77374-2_7. Adv Exp Med Biol. 2007. PMID: 18380343 Review.
-
Plant serine/arginine-rich proteins: roles in precursor messenger RNA splicing, plant development, and stress responses.Wiley Interdiscip Rev RNA. 2011 Nov-Dec;2(6):875-89. doi: 10.1002/wrna.98. Epub 2011 Jul 15. Wiley Interdiscip Rev RNA. 2011. PMID: 21766458 Review.
Cited by
-
Activation and repression functions of an SR splicing regulator depend on exonic versus intronic-binding position.Nucleic Acids Res. 2012 Jan;40(1):428-37. doi: 10.1093/nar/gkr713. Epub 2011 Sep 13. Nucleic Acids Res. 2012. PMID: 21914724 Free PMC article.
-
The multiple lives of NMD factors: balancing roles in gene and genome regulation.Nat Rev Genet. 2008 Sep;9(9):699-712. doi: 10.1038/nrg2402. Nat Rev Genet. 2008. PMID: 18679436 Free PMC article. Review.
-
The identification of protein and RNA interactors of the splicing factor Caper in the adult Drosophila nervous system.Front Mol Neurosci. 2023 Jun 23;16:1114857. doi: 10.3389/fnmol.2023.1114857. eCollection 2023. Front Mol Neurosci. 2023. PMID: 37435576 Free PMC article.
-
Gene expression noise is affected differentially by feedback in burst frequency and burst size.J Math Biol. 2017 May;74(6):1483-1509. doi: 10.1007/s00285-016-1059-4. Epub 2016 Sep 24. J Math Biol. 2017. PMID: 27665109
-
Alternative splicing perspective to prey preference of environmentally friendly biological agent Cryptolaemus montrouzieri.BMC Genomics. 2024 Oct 15;25(1):967. doi: 10.1186/s12864-024-10870-6. BMC Genomics. 2024. PMID: 39407100 Free PMC article.
References
-
- Black DL (2000) Protein diversity from alternative splicing: a challenge for bioinformatics and post-genome biology. Cell 103: 367–370 - PubMed
-
- Black DL (2003) Mechanisms of alternative pre-messenger RNA splicing. Annu Rev Biochem 72: 291–336 - PubMed
-
- Burtis KC, Baker BS (1989) Drosophila doublesex gene controls somatic sexual differentiation by producing alternatively spliced mRNAS encoding related sex-specific polypeptides. Cell 56: 997–1010 - PubMed
Publication types
MeSH terms
Substances
Grants and funding
LinkOut - more resources
Full Text Sources
Molecular Biology Databases
Research Materials
Miscellaneous
