

Differential requirement of SAGA subunits for Mot1p and Taf1p recruitment in gene activation
- PMID: 15923605
- PMCID: PMC1140607
- DOI: 10.1128/MCB.25.12.4863-4872.2005
Differential requirement of SAGA subunits for Mot1p and Taf1p recruitment in gene activation
Abstract
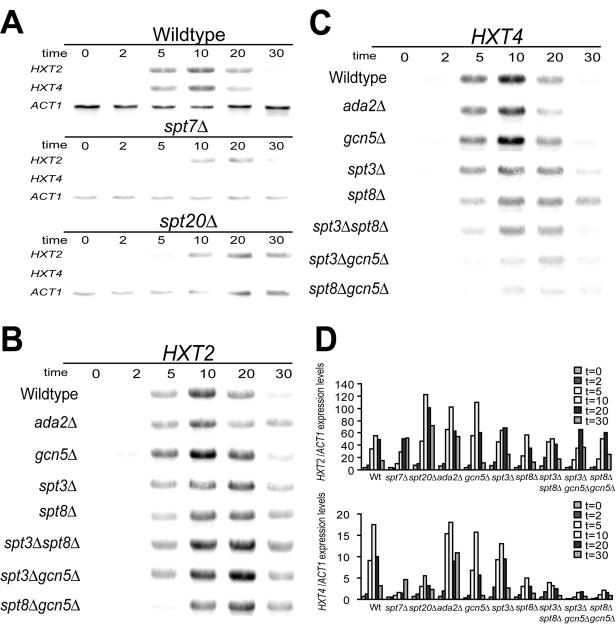
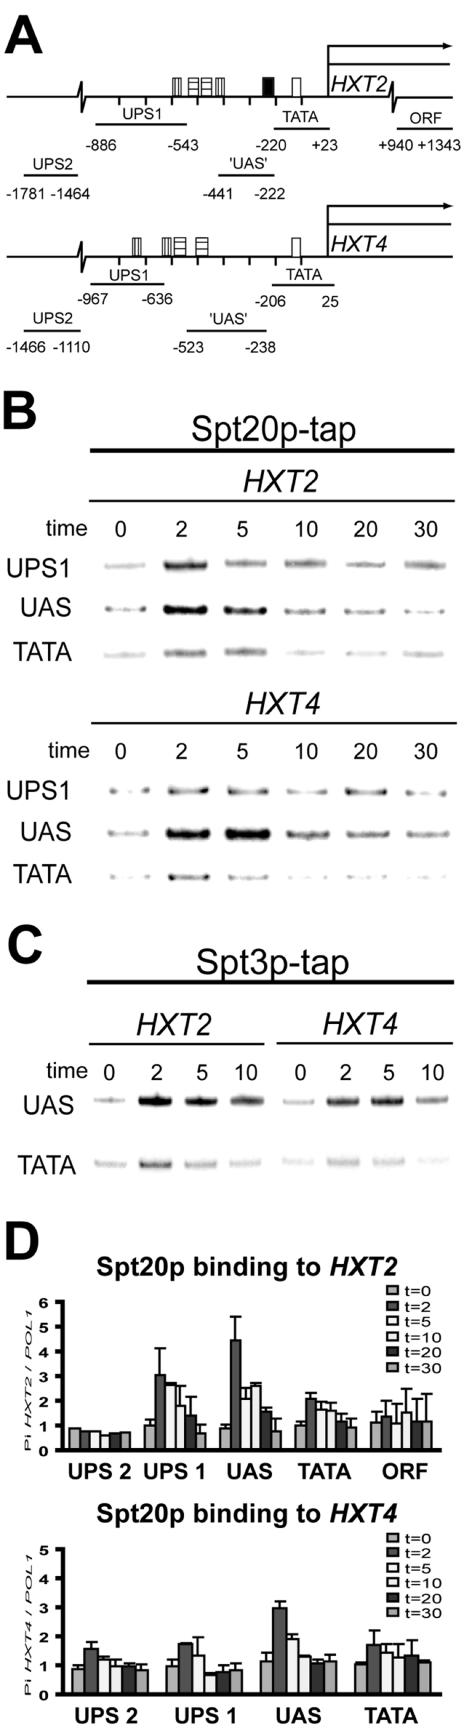
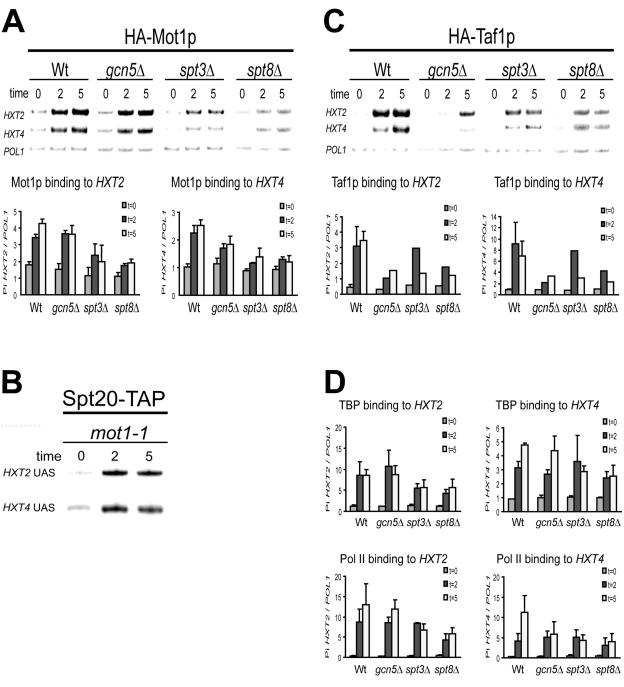
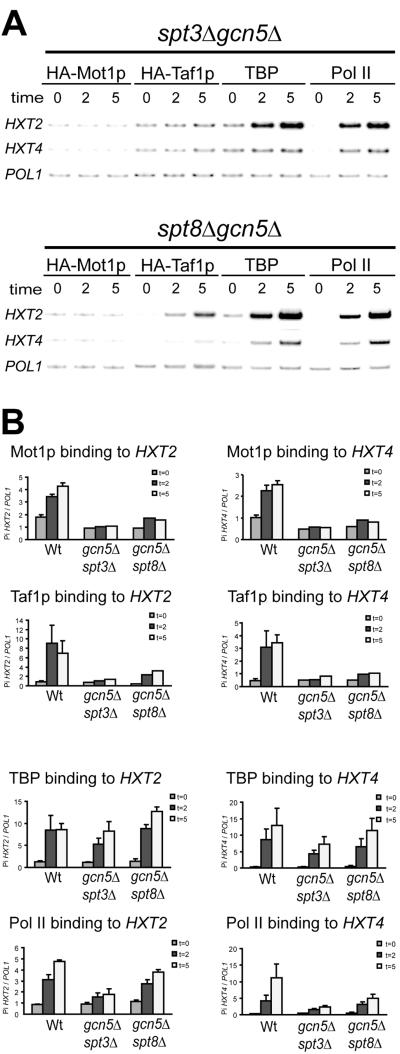
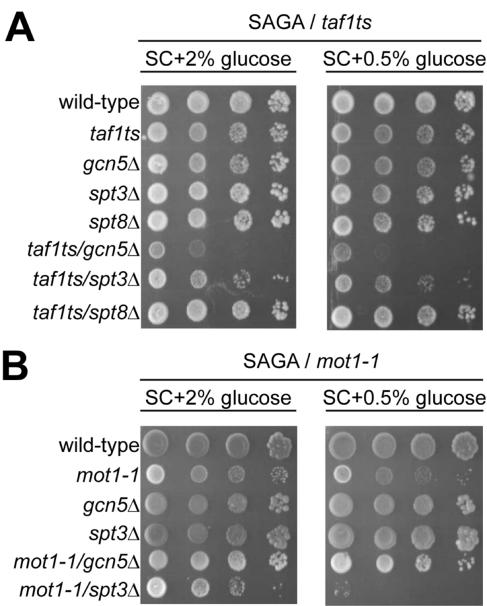
Transcription activation in yeast (Saccharomyces cerevisiae) involves ordered recruitment of transcription factor complexes, such as TFIID, SAGA, and Mot1p. Previously, we showed that both Mot1p and Taf1p are recruited to the HXT2 and HXT4 genes, which encode hexose transporter proteins. Here, we show that SAGA also binds to the HXT2 and HXT4 promoters and plays a pivotal role in the recruitment of Mot1p and Taf1p. The deletion of either SPT3 or SPT8 reduces Mot1p binding to HXT2 and HXT4. Surprisingly, the deletion of GCN5 reduces Taf1p binding to both promoters. When GCN5 is deleted in spt3Delta or spt8Delta strains, neither Mot1p nor Taf1p binds, and this results in a diminished recruitment of TATA binding protein and polymerase II to the HXT4 but not the HXT2 promoter. This is reflected by the SAGA-dependent expression of HXT4. In contrast, SAGA-independent induction of HXT2 suggests a functional redundancy with other factors. A functional interplay of different SAGA subunits with Mot1p and Taf1p was supported by phenotypic analysis of MOT1 SAGA or TAF1/SAGA double mutant strains, which revealed novel genetic interactions between MOT1 and SPT8 and between TAF1 and GCN5. In conclusion, our data demonstrate functional links between SAGA, Mot1p, and TFIID in HXT gene regulation.
Figures
Similar articles
-
Mot1p is essential for TBP recruitment to selected promoters during in vivo gene activation.EMBO J. 2002 Oct 1;21(19):5173-83. doi: 10.1093/emboj/cdf485. EMBO J. 2002. PMID: 12356733 Free PMC article.
-
SAGA mediates transcription from the TATA-like element independently of Taf1p/TFIID but dependent on core promoter structures in Saccharomyces cerevisiae.PLoS One. 2017 Nov 27;12(11):e0188435. doi: 10.1371/journal.pone.0188435. eCollection 2017. PLoS One. 2017. PMID: 29176831 Free PMC article.
-
Simultaneous recruitment of coactivators by Gcn4p stimulates multiple steps of transcription in vivo.Mol Cell Biol. 2005 Jul;25(13):5626-38. doi: 10.1128/MCB.25.13.5626-5638.2005. Mol Cell Biol. 2005. PMID: 15964818 Free PMC article.
-
Roles for BTAF1 and Mot1p in dynamics of TATA-binding protein and regulation of RNA polymerase II transcription.Gene. 2003 Oct 2;315:1-13. doi: 10.1016/s0378-1119(03)00714-5. Gene. 2003. PMID: 14557059 Review.
-
SAGA and TFIID: Friends of TBP drifting apart.Biochim Biophys Acta Gene Regul Mech. 2021 Feb;1864(2):194604. doi: 10.1016/j.bbagrm.2020.194604. Epub 2020 Jul 14. Biochim Biophys Acta Gene Regul Mech. 2021. PMID: 32673655 Review.
Cited by
-
A proteomics analysis of yeast Mot1p protein-protein associations: insights into mechanism.Mol Cell Proteomics. 2008 Nov;7(11):2090-106. doi: 10.1074/mcp.M800221-MCP200. Epub 2008 Jul 2. Mol Cell Proteomics. 2008. PMID: 18596064 Free PMC article.
-
Gcn5p-dependent acetylation induces degradation of the meiotic transcriptional repressor Ume6p.Mol Biol Cell. 2012 May;23(9):1609-17. doi: 10.1091/mbc.E11-06-0536. Epub 2012 Mar 21. Mol Biol Cell. 2012. PMID: 22438583 Free PMC article.
-
Distinct promoter dynamics of the basal transcription factor TBP across the yeast genome.Nat Struct Mol Biol. 2009 Oct;16(10):1043-8. doi: 10.1038/nsmb.1674. Epub 2009 Sep 20. Nat Struct Mol Biol. 2009. PMID: 19767748
-
TATA-binding protein variants that bypass the requirement for Mot1 in vivo.J Biol Chem. 2009 Feb 13;284(7):4525-35. doi: 10.1074/jbc.M808951200. Epub 2008 Dec 21. J Biol Chem. 2009. PMID: 19098311 Free PMC article.
-
Improvement of Lead Tolerance of Saccharomyces cerevisiae by Random Mutagenesis of Transcription Regulator SPT3.Appl Biochem Biotechnol. 2018 Jan;184(1):155-167. doi: 10.1007/s12010-017-2531-3. Epub 2017 Jun 27. Appl Biochem Biotechnol. 2018. PMID: 28656551
References
-
- Auble, D. T., K. E. Hansen, C. G. F. Mueller, W. S. Lane, J. Thorner, and S. Hahn. 1994. Mot1, a global repressor of RNA polymerase II transcription, inhibits TBP binding to DNA by an ATP-dependent mechanism. Genes Dev. 8:1920-1934. - PubMed
-
- Basehoar, A. D., S. J. Zanton, and B. F. Pugh. 2004. Identification and distinct regulation of yeast TATA box-containing genes. Cell 116:699-709. - PubMed
Publication types
MeSH terms
Substances
LinkOut - more resources
Full Text Sources
Molecular Biology Databases