Involvement of clathrin and AP-2 in the trafficking of MHC class II molecules to antigen-processing compartments
- PMID: 15911768
- PMCID: PMC1138261
- DOI: 10.1073/pnas.0502206102
Involvement of clathrin and AP-2 in the trafficking of MHC class II molecules to antigen-processing compartments
Abstract
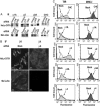
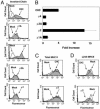
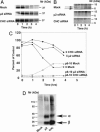
Major histocompatibility complex class II (MHC-II) molecules are composed of two polymorphic chains, alpha and beta, which assemble with an invariant chain, Ii, in the endoplasmic reticulum. The assembled MHC-II complexes are transported to the Golgi complex and then to late endosomes/lysosomes, where Ii is degraded and alphabeta dimers bind peptides derived from exogenous antigens. Targeting of MHC-II molecules to these compartments is mediated by two dileucine-based signals in the cytoplasmic domain of Ii. These signals bind in vitro to two adaptor protein (AP) complexes, AP-1 and AP-2, which are components of clathrin coats involved in vesicle formation and cargo sorting. The physiological roles of these proteins in MHC-II molecule trafficking, however, remain to be addressed. Here, we report the use of RNA interference to examine the involvement of clathrin and four AP complexes (AP-1, AP-2, AP-3, and AP-4) in MHC-II molecule trafficking in vivo. We found that depletion of clathrin or AP-2 caused >10-fold increases in Ii expression on the cell surface and a concomitant decrease in Ii localization to endosomal/lysosomal vesicles. In addition, depletion of clathrin or AP-2 delayed the degradation of Ii and reduced the surface expression of peptide-loaded alphabeta dimers. In contrast, depletion of AP-1, AP-3, or AP-4 had little or no effect. These findings demonstrate that clathrin and AP-2 participate in MHC-II molecule trafficking in vivo. Because AP-2 is only associated with the plasma membrane, these results also indicate that a significant pool of MHC-II molecules traffic to the endosomal-lysosomal system by means of the cell surface.
Figures


Similar articles
-
Trafficking of major histocompatibility complex class II molecules in human B-lymphoblasts deficient in the AP-3 adaptor complex.Immunol Lett. 2000 May 1;72(2):113-7. doi: 10.1016/s0165-2478(00)00176-0. Immunol Lett. 2000. PMID: 10841946
-
Intracellular transport of MHC class II and associated invariant chain in antigen presenting cells from AP-3-deficient mocha mice.Cell Immunol. 2001 Jun 15;210(2):143-53. doi: 10.1006/cimm.2001.1817. Cell Immunol. 2001. PMID: 11520080
-
The adaptor complex AP-2 regulates post-endocytic trafficking through the non-clathrin Arf6-dependent endocytic pathway.J Cell Sci. 2008 Dec 15;121(Pt 24):4008-17. doi: 10.1242/jcs.033522. Epub 2008 Nov 25. J Cell Sci. 2008. PMID: 19033387
-
The bio-logical role of invariant chain (Ii) in MHC class II antigen presentation.Immunol Lett. 1994 Dec;43(1-2):47-55. doi: 10.1016/0165-2478(94)00159-6. Immunol Lett. 1994. PMID: 7737689 Review.
-
Assembly, transport, and function of MHC class II molecules.Annu Rev Immunol. 1994;12:259-93. doi: 10.1146/annurev.iy.12.040194.001355. Annu Rev Immunol. 1994. PMID: 8011283 Review.
Cited by
-
Dual loss of ER export and endocytic signals with altered melanosome morphology in the silver mutation of Pmel17.Mol Biol Cell. 2006 Aug;17(8):3598-612. doi: 10.1091/mbc.e06-01-0081. Epub 2006 Jun 7. Mol Biol Cell. 2006. PMID: 16760433 Free PMC article.
-
Internalizing MHC class II-peptide complexes are ubiquitinated in early endosomes and targeted for lysosomal degradation.Proc Natl Acad Sci U S A. 2013 Dec 10;110(50):20188-93. doi: 10.1073/pnas.1312994110. Epub 2013 Nov 25. Proc Natl Acad Sci U S A. 2013. PMID: 24277838 Free PMC article.
-
The AP-2 adaptor beta2 appendage scaffolds alternate cargo endocytosis.Mol Biol Cell. 2008 Dec;19(12):5309-26. doi: 10.1091/mbc.e08-07-0712. Epub 2008 Oct 8. Mol Biol Cell. 2008. PMID: 18843039 Free PMC article.
-
The ins and outs of MHC class II-mediated antigen processing and presentation.Nat Rev Immunol. 2015 Apr;15(4):203-16. doi: 10.1038/nri3818. Epub 2015 Feb 27. Nat Rev Immunol. 2015. PMID: 25720354 Free PMC article. Review.
-
Salmonella polarises peptide-MHC-II presentation towards an unconventional Type B CD4+ T-cell response.Eur J Immunol. 2013 Apr;43(4):897-906. doi: 10.1002/eji.201242983. Epub 2013 Feb 18. Eur J Immunol. 2013. PMID: 23319341 Free PMC article.
References
-
- Holling, T. M., Schooten, E. & Van Den Elsen, P. J. (2004) Hum. Immunol. 65, 282–290. - PubMed
-
- Peters, P. J., Neefjes, J. J., Oorschot, V., Ploegh, H. L. & Geuze, H. J. (1991) Nature 349, 669–676. - PubMed
-
- Castellino, F. & Germain, R. N. (1995) Immunity 2, 73–88. - PubMed
-
- Cresswell, P. (1994) Annu. Rev. Immunol. 12, 259–293. - PubMed
Publication types
MeSH terms
Substances
LinkOut - more resources
Full Text Sources
Research Materials

