. 2005 May 23;169(4):577-89.
doi: 10.1083/jcb.200412101. Epub 2005 May 16.

Histone modifications affect timing of oligodendrocyte progenitor differentiation in the developing rat brain

Affiliations

Histone modifications affect timing of oligodendrocyte progenitor differentiation in the developing rat brain

Siming Shen et al. J Cell Biol. .

Abstract

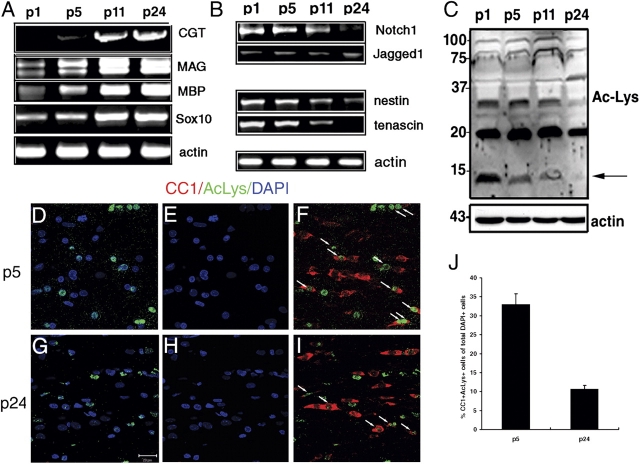
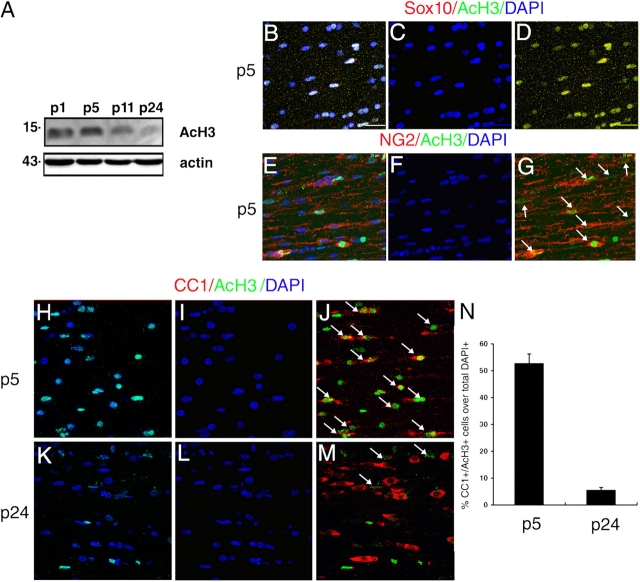
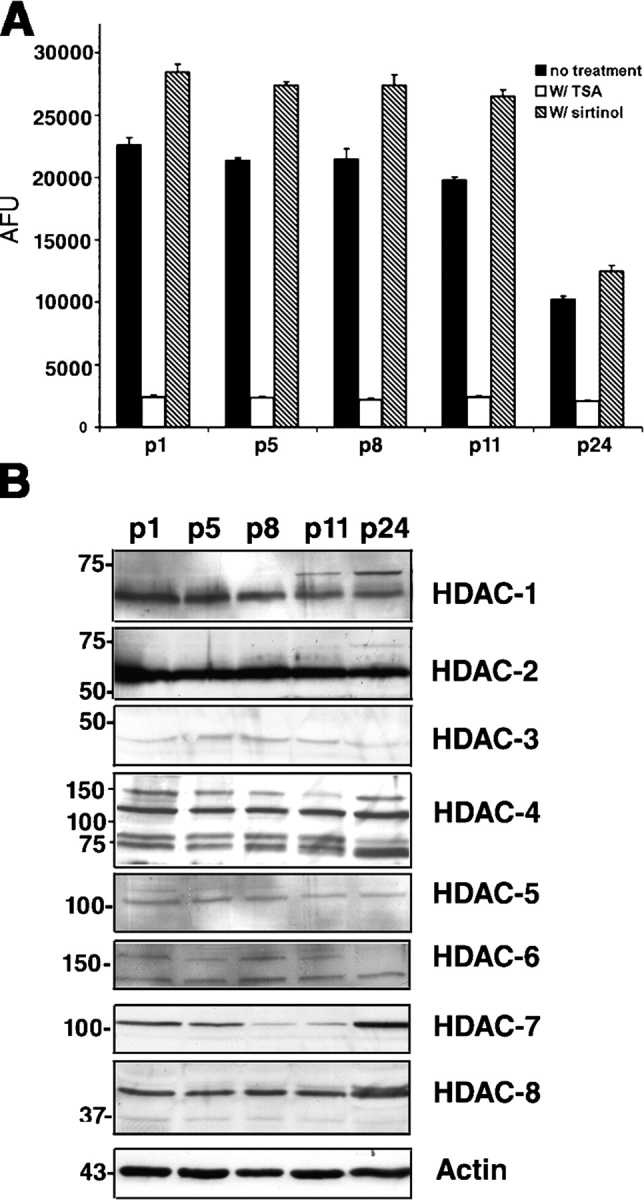
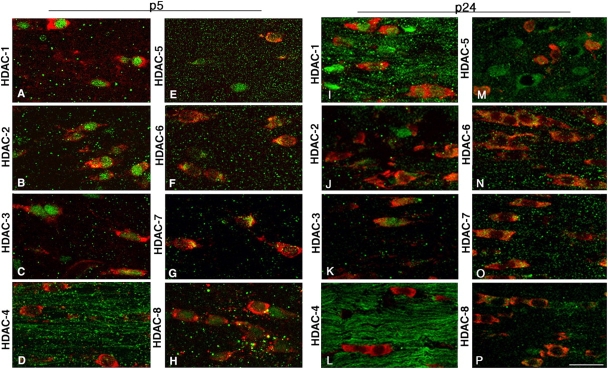
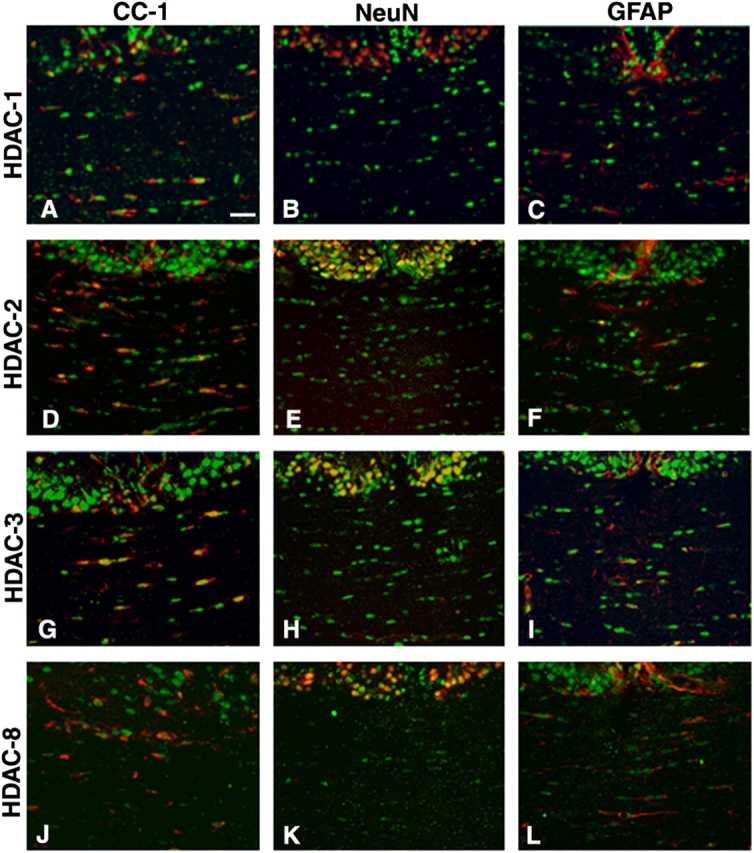
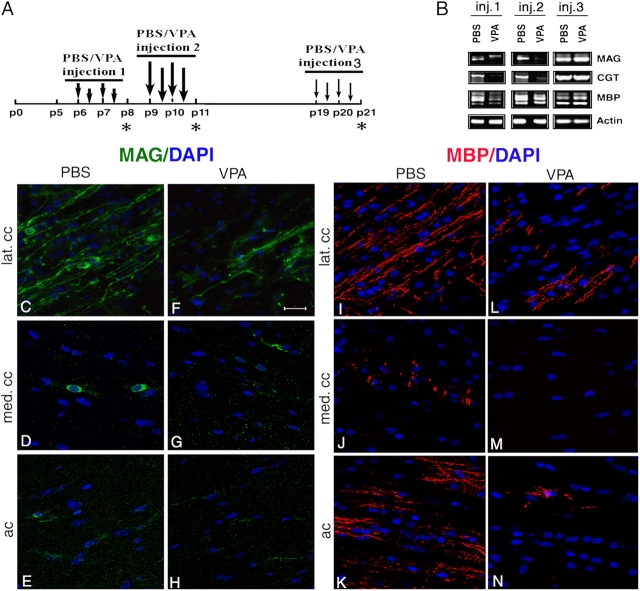
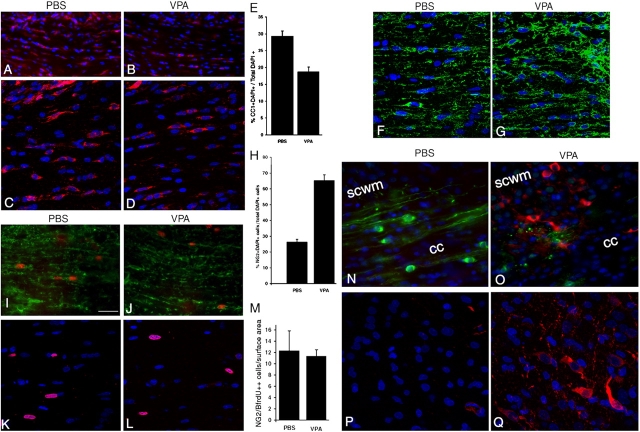
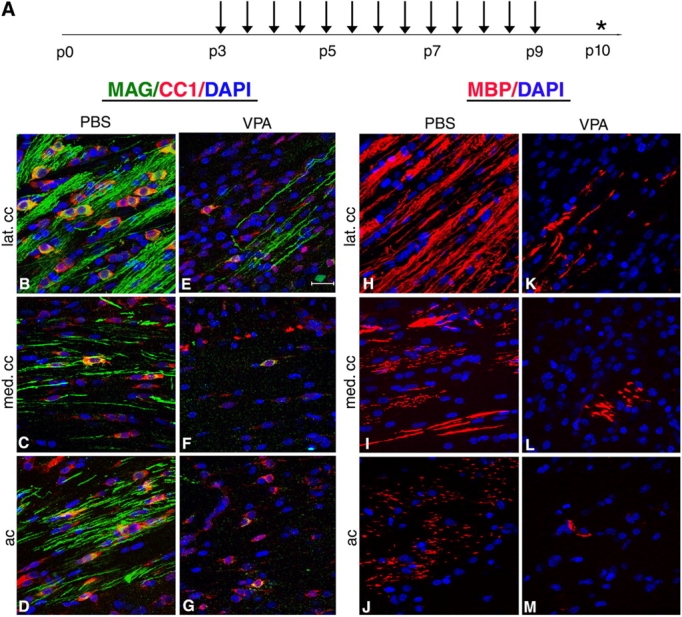
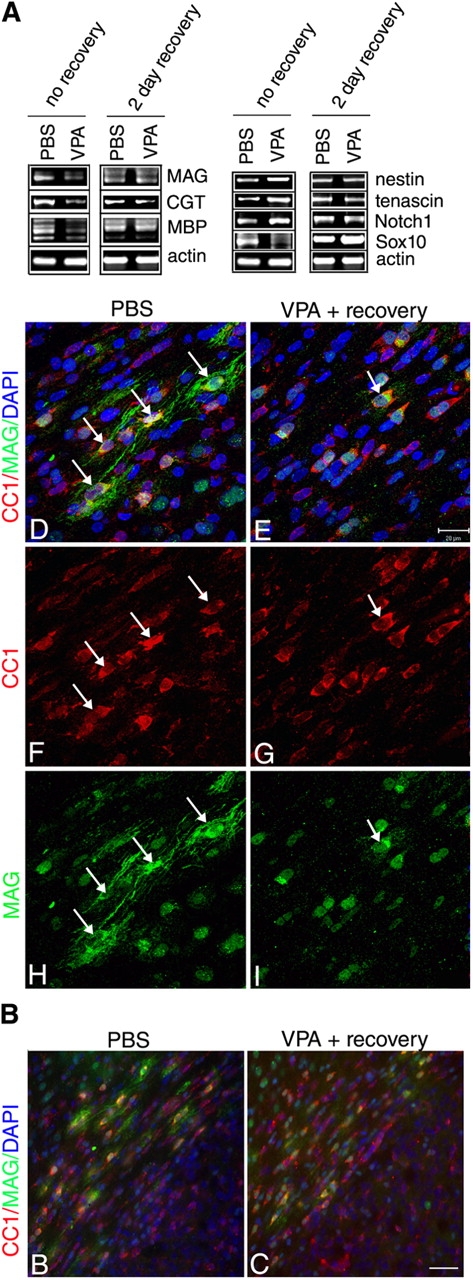
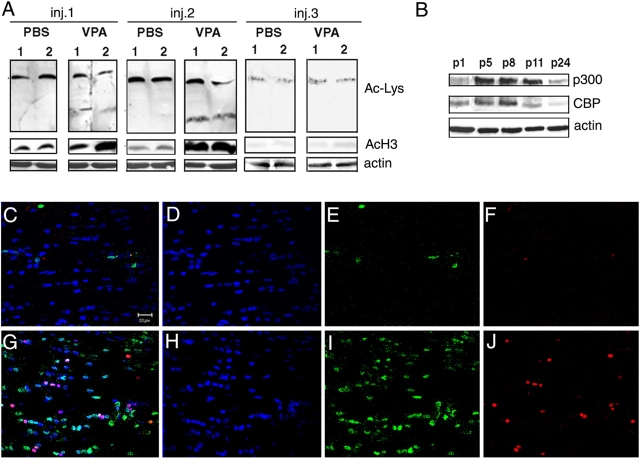
Timely differentiation of progenitor cells is critical for development. In this study we asked whether global epigenetic mechanisms regulate timing of progenitor cell differentiation into myelin-forming oligodendrocytes in vivo. Histone deacetylation was essential during a specific temporal window of development and was dependent on the enzymatic activity of histone deacetylases, whose expression was detected in the developing corpus callosum. During the first 10 postnatal days, administration of valproic acid (VPA), the specific inhibitor for histone deacetylase activity, resulted in significant hypomyelination with delayed expression of late differentiation markers and retained expression of progenitor markers. Differentiation resumed in VPA-injected rats if a recovery period was allowed. Administration of VPA after myelination onset had no effect on myelin gene expression and was consistent with changes of nucleosomal histones from reversible deacetylation to more stable methylation and chromatin compaction. Together, these data identify global modifications of nucleosomal histones critical for timing of oligodendrocyte differentiation and myelination in the developing corpus callosum.


Figures

Figure 1.
Figure 1.
Global changes of gene expression in the developing corpus callosum correlated with decreased protein acetylation. (A) RT-PCR of total RNA extracted from the anterior corpus callosum of p1, p5, p11, and p24 rats and amplified with primers for CGT, MAG, MBP, and Sox10 and actin. (B) RT-PCR of total RNA amplified with primers for Notch-1, Jagged-1, nestin, tenascin, and actin. (C) Western blot of protein extracted from the anterior corpus callosum at the indicated time points and probed with anti-acetyl-lysine (AcLys) antibodies. Actin was used as loading control. Note the deacetylation of the14-kD band (arrow) occurring at the onset of myelination. (D–I) Coronal brain sections from p5 (D–F) and p24 (G–I) were stained with AcLys (D, F, G, and I, green), CC1 (F and I, red), and DAPI (blue) as counterstain. Bar, 20 μm. 63× objective, LSM510 microscope (Carl Zeiss MicroImaging, Inc.). Double-labeled CC1+/AcLys+ cells (F and I, white arrows) were counted within the same area of the medial corpus callosum at each time point and referred to the total number of CC1+ cells. The differences between the two time points were statistically different (P < 0.001) (J). These data are representative of at least three independent experiments using three individual rat pups for each time point.
Figure 2.
Figure 2.
Histone H3 acetylation in OL progenitors of the medial corpus callosum progressively decreased during postnatal development. The 14-kD protein undergoing deacetylation during the first two postnatal days was identified by Western blot analysis using antibodies recognizing acetylated histone H3 (AcH3) and actin as loading control (A). To confirm that AcH3 was present in the nuclei of cells of the OL lineage, brain sections were labeled with antibodies against AcH3 (B, D, E, and G, green), Sox10 (B and D, red), NG2 (E and G, red), and DAPI (blue) as nuclear counterstain. Bar, 20 μm. 63× objective, LSM510 microscope (Carl Zeiss MicroImaging, Inc.). Double-positive cells are indicated by white arrows. (H–M) Confocal images of the medial corpus callosum at p5 and p24 stained for AcH3 (H, J, K, and M, green), CC1 (J and M, red), and DAPI (blue). Compare the similar density of DAPI+ nuclei with the decrease of CC1+/AcH3+ cells (J and M, white arrows). The CC1+/AcH3+ cells were counted and referred to the total number of CC1+ cells (N). The bar graph shows the statistically significant (P < 0.001) decrease of AcH3+/CC1+ cells from p5 to p24.
Figure 3.
Figure 3.
Total HDAC activity in extracts of the developing rostral corpus callosum. (A) Total HDAC activity was measured in protein extracts from anterior corpus callosum at p1, p5, p8, p11, and p24 using an acetylated fluorimetric substrate (black bars). The experiments were then repeated by incubating the same samples with TSA (white bars), or with sirtinol (hatched bars). (B) The protein levels of distinct HDAC isoforms were assessed by Western blot analysis on the same tissue extracts. Blots were probed with antibodies against class I (HDAC-1, -2, -3, and -8) and class II (HDAC-4, -5, -6, and -7), and actin as loading control.
Figure 4.
Figure 4.
Cellular and temporal profile of expression of class I and II HDACs in maturing OLs. Confocal images of the medial part of the body of the corpus callosum at rostral levels, identified in coronal brain sections from p5 (A–H) and p24 (I–P) neonatal rats, after staining with antibodies for HDAC-1 to -8 (A–P, green) and for CC1 (A–P, red). Bar, 20 μm. 63× objective, LSM510 confocal microscope (Carl Zeiss MicroImaging, Inc.).
Figure 5.
Figure 5.
Cell specificity of class I HDAC expression during the first postnatal week of development. Immunohistochemistry of coronal brain sections from p5 rat pups stained with antibodies against HDAC-1, -2, -3, and -8 (A–L, green), CC1 (A, D, G, and J, red), NeuN (B, E, H, and K, red), and GFAP (C, F, I, and L, red). Bar, 20 μm. 25× objective, DM RA (Leica). Each immunostaining was performed at least three times from three distinct p5 rat brains.
Figure 6.
Figure 6.
Pharmacological blockers of HDAC activity induced hypomyelination when administered during a critical temporal window of development. (A) Schematic representation of three distinct PBS/VPA injection paradigms to the neonatal rats. Each group was composed of 12 animals, receiving four injections (arrows) of either PBS (n = 6) or VPA (n = 6) at the indicated times. Harvest time is indicated by the asterisk. (B) Semi-quantitative RT-PCR analysis of the effect of the three treatments on myelin gene expressions. Total RNA was isolated at each time point (3 PBS- and 3 VPA-injected pups), and the reverse-transcribed cDNA was amplified using primers specific to MAG, CGT, and MBP, and actin as loading control. (C–N) MAG+ immunofluorescence in control animals was detected in the soma of OL and in myelinated fibers in the lateral corpus callosum (C, lat. cc, green), in the soma of OL in the medial corpus callosum (D, med. cc, green), and in the anterior commissure (E, ac, green). Fewer MAG+ cells and myelinated fibers were detected in the lateral (F) and medial (G) corpus callosum, and in the anterior commissure (H) of VPA-injected rats. (I–N) The pattern of MBP immunofluorescence was similar and showed several myelinated fibers in the lateral corpus callosum (I) and in the anterior commissure (K) of control rats and very few MBP+ fibers in the same brain regions of VPA-treated animals (L–N). Bar, 20 μm. 63× objective, LSM510 confocal microscope (Carl Zeiss MicroImaging, Inc.).
Figure 7.
Figure 7.
Hypomyelination in VPA-treated rats resulted from delayed differentiation of OL progenitors. Coronal brain sections from PBS- (A and C) and VPA (B and D) -injected rats (inj1) were processed for immunohistochemistry using antibodies for CC1 (A and D, red) and DAPI as nuclear counterstain. The number of CC1+ cells was referred to as a percentage of the total DAPI + nuclei (E) and was statistically different in the two treatment groups (P < 0.01). The decreased number of CC1+ cells was paralleled by an increased number of OL progenitors identified by the surface marker NG2 (F and G, green). The number of NG2+ cells per total DAPI+ cells in PBS- and VPA-treated rat corpus callosum showed a statistically significant difference (P < 0.001) (H). (I–M) The increased number of progenitors was not due to impaired exit from the cell cycle. Cells in the S phase of the cell cycle were labeled in vivo and then identified by immunofluorescence for BrdU (I–L, red) and for NG2 (I and J, green). The number of NG2+/BrdU+ cells (M) was not significantly different between the two groups (P > 0.5). (N–Q) The subcortical white matter (scwm) and the corpus callosum (cc) of PBS- (N and P) or VPA (O and Q) -injected rat brains were double stained with antibodies for MAG (N and O, green) and for PSA-NCAM (O and Q, red). Bar in A, B, I, and J = 100 μm. 32× objective, DM RA (Leica). Bar in K–L, 20 μm. 63× objective, LSM510 microscope (Carl Zeiss MicroImaging, Inc.).
Figure 8.
Figure 8.
Long-term treatment with HDAC inhibitors dramatically decreases myelination in the corpus callosum and anterior commissure of the developing rat. (A) Schematic representation of the long-term PBS/VPA treatment to neonatal rats. Each group was composed of 12 animals, receiving 13 injections (arrows) of either PBS (n = 6) or VPA (n = 6) at the indicated times. Tissue was harvested on p10 (asterisk). Note that in control rats, several OL were labeled by CC1 (B–D, red) and the majority of fibers in the lateral corpus callosum (B and H) and anterior commissure (D) were myelinated, as indicated by the intense immunoreactivity for MAG (B–G, green) and MBP (H–M, red). In VPA-treated rats, only very few cells expressed CC1 (E–G, red) and the majority of the fibers were not myelinated, as shown by the lack of MAG (E–G, green) and MBP (K–M, red) immunofluorescence. DAPI (B–M, blue) was used as nuclear counterstain. Bar, 20 μm. 63× objective, LSM510 microscope (Carl Zeiss MicroImaging, Inc.).
Figure 9.
Figure 9.
The inhibitory effect of VPA on OL differentiation was reversible. (A) To address whether OL differentiation was delayed or irreversibly impaired by VPA treatment, we repeated protocol 1 with a recovery period of 3 d after the last injection. At p11 RNA was extracted, and the myelin gene expression and the presence of inhibitors were assessed by semi-quantitative RT-PCR. (B and C) Micrographs of coronal brain sections stained for CC1 (red), MAG (green), and DAPI (blue). Bar, 100 μm. 32× objective, DM RA (Leica). (D–I) Confocal images of the lateral corpus callosum of PBS- or VPA-injected rats after 2 d of recovery. Although extensive myelination was observed in PBS-treated controls (D, F, and H, white arrows), the majority of cells in the VPA-treated animals were CC1, but only few of them had started to myelinate (E, G, and I, white arrow). Bar, 20 μm. 63× objective, LSM510 microscope (Carl Zeiss MicroImaging, Inc.).
Figure 10.
Figure 10.
Global histone deacetylation occurred only during the first two weeks of postnatal development and was followed by histone methylation and chromatin compaction. (A) To confirm the inhibitory effect of VPA, Western blot analysis was performed on total proteins extracted from the corpus callosum of injected rats using antibody for AcLys. The increased acetylated 14-kD band was confirmed to be histone H3 by using antibody for AcH3. At p21, VPA injection did not increase histone H3 acetylation. (B) Western blot analysis of total protein extracted from the body of developing corpus callosum at anterior levels at the indicated time points. The blots were probed with antibodies for the HATs CBP and p300, and actin was used as loading control. (C–J) Immunofluorescence on cryosections using antibodies specific for methylated lysine 9 on histone H3 (MeK9H3; C, E, G, and I, green) and for HP1 α (C, F, G, and J, red). Co-expression of HP1α and MeK9H3 in p24 corpus callosum reveals the establishment of a compact chromatin structure at later stages of OL differentiation. Bar, 20 μm. 63× objective, LSM510 microscope (Carl Zeiss MicroImaging, Inc.).

Similar articles

Cited by

References

    1. Bannister, A.J., P. Zegerman, J.F. Partridge, E.A. Miska, J.O. Thomas, R.C. Allshire, and T. Kouzarides. 2001. Selective recognition of methylated lysine 9 on histone H3 by the HP1 chromo domain. Nature. 410:120–124. - PubMed
    1. Barres, B.A., M.A. Lazar, and M.C. Raff. 1994. A novel role for thyroid hormone, glucocorticoids and retinoic acid in timing oligodendrocyte development. Development. 120:1097–1108. - PubMed
    1. Bjartmar, C., C. Hildebrand, and K. Loinder. 1994. Morphological heterogeneity of rat oligodendrocytes: electron microscopic studies on serial sections. Glia. 11:235–244. - PubMed
    1. Bjelke, B., and A. Seiger. 1989. Morphological distribution of MBP-like immunoreactivity in the brain during development. Int. J. Dev. Neurosci. 7:145–164. - PubMed
    1. Bjerling, P., R.A. Silverstein, G. Thon, A. Caudy, S. Grewal, and K. Ekwall. 2002. Functional divergence between histone deacetylases in fission yeast by distinct cellular localization and in vivo specificity. Mol. Cell. Biol. 22:2170–2181. - PMC - PubMed

Publication types

MeSH terms