. 2005;6(4):R33.
doi: 10.1186/gb-2005-6-4-r33. Epub 2005 Mar 29.

Promoter features related to tissue specificity as measured by Shannon entropy

Affiliations

Promoter features related to tissue specificity as measured by Shannon entropy

Jonathan Schug et al. Genome Biol. 2005.

Abstract

Background: The regulatory mechanisms underlying tissue specificity are a crucial part of the development and maintenance of multicellular organisms. A genome-wide analysis of promoters in the context of gene-expression patterns in tissue surveys provides a means of identifying the general principles for these mechanisms.

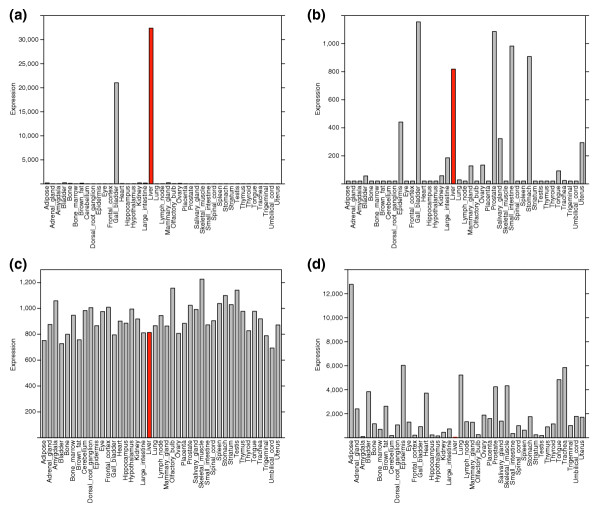
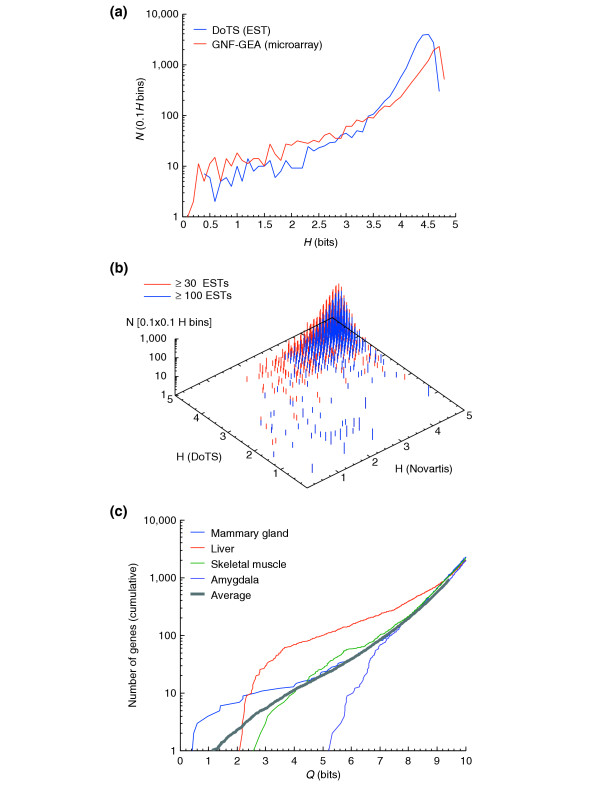
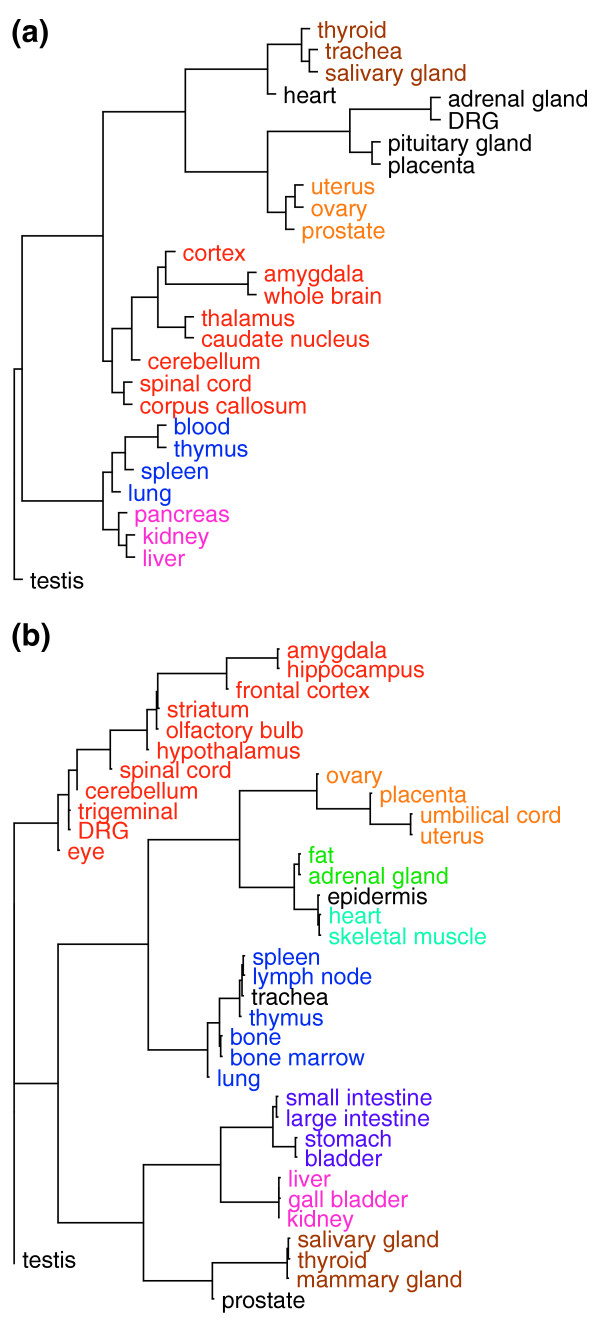
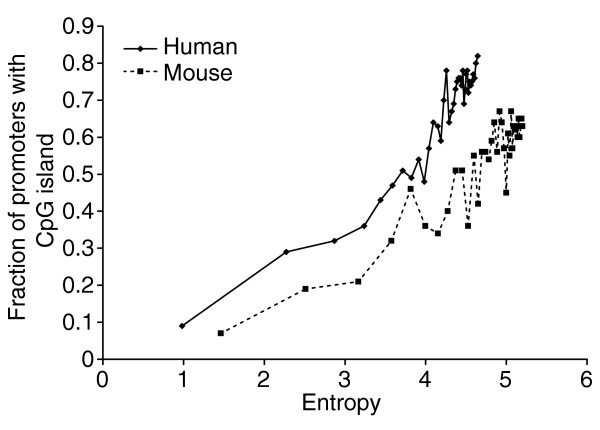
Results: We introduce a definition of tissue specificity based on Shannon entropy to rank human genes according to their overall tissue specificity and by their specificity to particular tissues. We apply our definition to microarray-based and expressed sequence tag (EST)-based expression data for human genes and use similar data for mouse genes to validate our results. We show that most genes show statistically significant tissue-dependent variations in expression level. We find that the most tissue-specific genes typically have a TATA box, no CpG island, and often code for extracellular proteins. As expected, CpG islands are found in most of the least tissue-specific genes, which often code for proteins located in the nucleus or mitochondrion. The class of genes with no CpG island or TATA box are the most common mid-specificity genes and commonly code for proteins located in a membrane. Sp1 was found to be a weak indicator of less-specific expression. YY1 binding sites, either as initiators or as downstream sites, were strongly associated with the least-specific genes.

Conclusions: We have begun to understand the components of promoters that distinguish tissue-specific from ubiquitous genes, to identify associations that can predict the broad class of gene expression from sequence data alone.


Figures

Figure 1
Figure 1
Examples of GNF-GEA expression patterns for mouse genes at selected Hg and Q. Liver, indicated in red, is the tissue of interest for Q values. (a) Serum albumin (94777_at Alb1) shows very specific liver expression: H = 1.3 bits and Qliver = 2.1 bits. (b) For liver-specific bHLH-Zip transcription factor (99452_at Lisch7), liver is a strong but not dominant part of the expression pattern: H = 3.7 bits and Qliver = 6.8 bits. (c) For chloride channel 7 (104391_s_at Clcn7) there is near uniform expression: H = 4.3 bits and Qliver = 10.2 bits. (d) Gelsolin (93750_at Gsn) is an otherwise widely expressed gene but is expressed at a very low level in the liver: H = 4.4 bits and Qliver = 15.1 bits.
Figure 2
Figure 2
Distributions of H and Q for different data sources and tissues. (a) Distribution of H as estimated from GNF-GEA (red line) and DoTS (blue line). The DoTS curve was generated from genes with at least six ESTs. (b) Correlation of H estimates from GNF-GEA and DoTS. Genes with at least 30 ESTs are shown in red; those with more than 100 ESTs in blue. (c) Cumulative distribution of Q values for selected mouse tissues and the average for all 39 tissues. Mammary gland, liver, muscle and the amygdala have decreasing numbers of highly tissue-specific genes. Liver has a very large number of relatively specific genes. All distributions peak at 2 log2(39) = 10.6 bits and have a tail at high Q (not shown) that corresponds to genes that are ubiquitously expressed except in the tissue of interest.
Figure 3
Figure 3
Consensus tissue tree of tissues from human and mouse data. Trees are the consensus of trees created from 5,000 random samples of sets of 1,000 genes from (a) 3,768 (human) or (b) 1,786 (mouse) genes with Qg|t ≤ 7 bits in at least one tissue. The length of the line leading into a node indicates how many trees did not include the set of tissues to the right of the node. The shortest lines correspond to unanimous subgroups. We have highlighted all maximal subgroups that occurred in at least half of the sampled trees. The nervous system is indicated in red, immune system in blue, reproductive tissue in yellow, digestive organs in purple and magenta, muscle tissue in cyan, and glandular tissue in brown. All maximal subgroups that occurred in at least half of the sampled trees. The tissues not included in a highlighted subgroup typically have statistically significant overlap with many of the highlighted tissues as estimated using the hypergeometric distribution.
Figure 4
Figure 4
The fraction of start CpG islands in genes ranked by entropy Hg increases with entropy. Each point represents the fraction of genes in consecutive groups of 100 genes ranked by entropy Hg computed from GNF-GEA data. Genes in this set are expressed above 200 AU in at least one tissue. The human dataset (diamonds) has 26 tissues (maximum H = 4.7 bits), the mouse dataset (squares) has 42 tissues (maximum H = 5.3 bits).
Figure 5
Figure 5
Base-composition profiles for ubiquitous and tissue-specific genes with and without start CpG islands. Data is for human genes; similar patterns were observed in mouse. (a) Ubiquitous genes with a CpG island; (b) tissue-specific genes with a CpG island; (c) ubiquitous genes with no CpG island; and (d) tissue-specific genes with no CpG island. Note differences in upstream C+G content, peak sizes at TATA box (-35 bp) and initiator positions, and downstream C versus G differences.
Figure 6
Figure 6
YY1 motifs are found downstream of the transcription start site, depending on their orientation. (a) The top image shows a logo [69] representation of the YY1 motif in the (+10, +20) region of human CGI+ promoters identified using AlignACE. It is based on 102 sequences. The other two logos are for weight matrices contained in TRANSFAC v7.3 that represent activating and repressing YY1 binding sites. (b) Plot of the positional distribution of predicted YY1 sites and the fraction of genes with a predicted YY1 sites in the (+1, +60) region. YY1 sites were predicted using a weight matrix generated using AlignACE. YY1 sites are more than almost three times (P ≤ 2 × 10⁻⁷) as common in genes with nonspecific CGI+ genes (11%; N = 2,072) than in CGI- genes (4%; N = 607) and occur at more than 10 times the expected rate. Similar trends are observed in genes with 3 ≤ H ≤ 4 though with lower absolute and relative rates. The difference between CGI+ and CGI- genes is not statistically significant for genes in the 3 ≤ H ≤ 4 bin. Essentially no YY1 sites where observed in specific genes with H ≤ 3 bits whether or not they had a CpG island.
Figure 7
Figure 7
The distribution of TATA box and initiator element (Inr) in pancreas-specific genes. One hundred and sixty pancreas genes were divided into bins according to their Q-value. Genes that have a TATA box, an initiator with the motif YYANWYY, both, or none of these two motifs, are shown. (a) Absolute numbers of genes with core promoter motifs. Red bars, TATA only; blue bars, TATA and Inr; green bars, Inr only; purple bars, none. The p-values for pairwise comparison of distributions (TATA/total) are given below the graph. P-values were calculated for the sum of genes with TATA box (with and without initiator). (b) Results from (a) plotted as fractions of genes with each motif status within a bin. (c) Number of TATA boxes found in orthologous human and mouse gene pairs. Statistical significance of differences between Q bins are indicated.
Figure 8
Figure 8
The cumulative distribution of promoter classes as a function of entropy is similar in human and mouse. The cumulative fractions of genes with all possible combinations of CGI and TATA box features for (a) human and (b) mouse as a function of entropy Hg as computed from GNF-GEA data is shown. For example, in human about 50% of the genes with Hg ≤ 2.5 have a CGI-/TATA+ promoter. The gray bars indicate the entropy range that is not significantly different from uniform ubiquitous expression. Curves are compiled from genes that express above 200 AU in at least one tissue. As expected, CGI+/TATA- genes are most common in less specific genes and CGI-/TATA+ genes are most common in tissue-specific genes. CGI-/TATA- genes are very common and are found nearly uniformly at every level of specificity. Furthermore, CGI+/TATA- and CGI-/TATA+ genes are both common in mid-specificity (3 ≤ Hg ≤ 4) genes showing that specificity is not determined by these features alone. The trends in human and mouse data are nearly identical despite the lower rate of CpG islands in mouse. The large variations in the graph at low entropy are due to the noise inherent in the small number of genes in this range.

Similar articles

Cited by

References

    1. Bird AP. DNA methylation - how important in gene control? Nature. 1984;307:503–504. doi: 10.1038/307503a0. - DOI - PubMed
    1. Bird AP. DNA methylation versus gene expression. J Embryol Exp Morphol. 1984;83(Suppl):31–40. - PubMed
    1. Ponger L, Duret L, Mouchiroud D. Determinants of CpG islands: expression in early embryo and isochore structure. Genome Res. 2001;11:1854–1860. - PMC - PubMed
    1. Smale ST, Baltimore D. The 'initiator' as a transcription control element. Cell. 1989;57:103–113. doi: 10.1016/0092-8674(89)90176-1. - DOI - PubMed
    1. Shi Y, Seto E, Chang LS, Shenk T. Transcriptional repression by YY1, a human GLI-Kruppel-related protein, and relief of repression by adenovirus E1A protein. Cell. 1991;67:377–388. doi: 10.1016/0092-8674(91)90189-6. - DOI - PubMed

Publication types

Substances