. 2005 Jun;16(6):2759-71.
doi: 10.1091/mbc.e05-01-0069. Epub 2005 Mar 30.

Dictyostelium LIS1 is a centrosomal protein required for microtubule/cell cortex interactions, nucleus/centrosome linkage, and actin dynamics

Affiliations

Dictyostelium LIS1 is a centrosomal protein required for microtubule/cell cortex interactions, nucleus/centrosome linkage, and actin dynamics

Markus Rehberg et al. Mol Biol Cell. 2005 Jun.

Abstract

The widespread LIS1-proteins were originally identified as the target for sporadic mutations causing lissencephaly in humans. Dictyostelium LIS1 (DdLIS1) is a microtubule-associated protein exhibiting 53% identity to human LIS1. It colocalizes with dynein at isolated, microtubule-free centrosomes, suggesting that both are integral centrosomal components. Replacement of the DdLIS1 gene by the hypomorphic D327H allele or overexpression of an MBP-DdLIS1 fusion disrupted various dynein-associated functions. Microtubules lost contact with the cell cortex and were dragged behind an unusually motile centrosome. Previously, this phenotype was observed in cells overexpressing fragments of dynein or the XMAP215-homologue DdCP224. DdLIS1 was coprecipitated with DdCP224, suggesting that both act together in dynein-mediated cortical attachment of microtubules. Furthermore, DdLIS1-D327H mutants showed Golgi dispersal and reduced centrosome/nucleus association. Defects in DdLIS1 function also altered actin dynamics characterized by traveling waves of actin polymerization correlated with a reduced F-actin content. DdLIS1 could be involved in actin dynamics through Rho-GTPases, because DdLIS1 interacted directly with Rac1A in vitro. Our results show that DdLIS1 is required for maintenance of the microtubule cytoskeleton, Golgi apparatus and nucleus/centrosome association, and they suggest that LIS1-dependent alterations of actin dynamics could also contribute to defects in neuronal migration in lissencephaly patients.


Figures

Figure 1.
Figure 1.
Domain structure of DdLIS1 and alignment of the DdLIS1 and human LIS1 amino acid sequences. Like other LIS1 homologues, DdLIS1 is segmented into a LIS1-homology domain (LisH), a short coiled coil region (CC) and seven WD40 repeats. The alignment was performed with GAP-alignment (GCG package). The position of the D327H point mutation is highlighted by a black box.
Figure 2.
Figure 2.
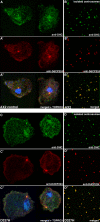
DdLIS1 localizes to microtubules, the mitotic spindle, and isolated centrosomes. DdLIS1 was stained using affinity-purified anti-DdLIS1 antibodies. The specificity of affinity-purified anti-DdLIS1 antibodies used for immunofluorescence microscopy is shown on a Western blot (A) of a Dictyostelium cell extract where only a single band at ∼50 kDa is stained. Subcellular localization of DdLIS1 during interphase (B) and mitosis (metaphase; C) is shown. Counterstainings were performed with anti-α-tubulin and the anti-DdCP224 mAb 2/165 (C′), which mainly stains spindle poles and kinetochores during this mitotic stage (Gräf et al., 1999, 2000b). The merged images (B″ and C″) show DdLIS1 in green and α-tubulin in red. DdLIS1 and the dynein heavy chain are also present at isolated centrosomes, which are devoid of microtubules (D and E). The control stainings against DdCP224, which is an established component of the centrosomal corona, demonstrates colocalization of these proteins at the corona (D′, D″, E′, E″). The merged images (D″, E″) show DdCP224 in red and DdLIS1 and dynein, respectively in green. (D‴) and (E‴) show respective tracings of fluorescence intensity along a line through the center of the centrosome (white line in D and E). The positions of the maxima of fluorescence intensity reveal exact colocalization of the dynein heavy chain and DdCP224, whereas DdLIS1-labeling is concentrated closer to the centrosomal core structure than DdCP224. All specimens were fixed with methanol. Bar, 2 μm.
Figure 3.
Figure 3.
The DdLIS1-D327H point mutation causes a collapse of interphase microtubule arrays and unusual centrosome motility. Immunofluorescence labeling of control cells (A) and DdLIS1-D327H cells (B) with anti-α-tubulin (yellow) and the DNA staining dye TOPRO3 (blue; Molecular Probes). Cells were fixed with glutaraldehyde. Live analysis of microtubule and centrosome behavior was performed with GFP-α-tubulin control cells (C, see Supplementary Movie1) and DdLIS1-D327H cells expressing GFP-α-tubulin (D, see Supplementary Movie2). Each image represents a brightest point z-projection of five confocal slices with a distance of 1 μm each. C′ and D′ display the movements of each centrosome within a time of 450 s by colored lines. The arrow points on a mitotic cell (prophase at time point 0 s). Average speed (E), maximum speed (E′), and the area enclosed by the centrosome movements (E″) within 450 s of control cells (gray columns) and DdLIS1-D327H cells (black columns) were evaluated using the manual tracking plugin for ImageJ. Bar, 5 μm.
Figure 4.
Figure 4.
DdLIS1-D327H cells show Golgi dispersal. Immunofluorescence labeling of control cells (A) and DdLIS1-D327H cells (B) with anti-DdSpc97 as a centrosome marker (red; A and B) and anticomitin as a Golgi marker (green; A′ and B′). Nuclei were stained with TOPRO3 (blue). These stainings were merged in A″ and B″. Cells were fixed with methanol. Bar, 5 μm.
Figure 5.
Figure 5.
Live observation of GFP-labeled microtubules during mitosis suggests the existence of cortical microtubule pulling forces. Supplementary Movie3. shows abscission of the radial microtubules from the centrosome in prophase (time point 120 s) and movement of the free microtubules toward the cell cortex. Each image represents a brightest point z-projection of five confocal slices with a distance of 1.6 μm each.
Figure 6.
Figure 6.
The DdLIS1-D327H point mutation weakens the nucleus/centrosome association. Immunofluorescence labeling of control cells (A) and DdLIS1-D327H cells (B) with anti-α-tubulin antibodies (green; A and B) and polyclonal anti-DdCP224 as a centrosome marker (red; A′ and B′). Nuclei were stained with TOPRO3 (blue). These stainings were merged in A″ and B″. Cells were fixed with glutaraldehyde. In DdLIS-D327H cells the distance between centrosomes and the DNA is greatly enhanced. Bar, 2 μm.
Figure 7.
Figure 7.
Subcellular localizations of dynein and DdCP224 are not significantly altered in DdLIS1-D327H cells. Immunofluorescence labeling of whole cells (A–A″ and C–C″) or isolated centrosomes (B–B″ and D–D″) with the antidynein heavy chain antibody 695 (green; A–D) and the monoclonal anti-DdCP224 antibody 2/165 (red; A′,B′,C′,D′). Nuclei were stained with TOPRO3 (blue; A″ and C″). Stainings were merged in A″–D″. AX2 control cells were used in (A–B″) and DdLIS1-D327H cells in (C–D″). Cells were fixed with formaldehyde/acetone and centrosomes with methanol.
Figure 8.
Figure 8.
Coprecipitation of DdLIS1 with DdCP224 with dynein. Experiments were performed using cytosolic extracts from MBP-DdLIS1 cells or wild-type cells (strain AX2). The respective antibodies used staining of the immunoblots and for immunoprecipitation are indicated above and below the blots, respectively. Abbreviations and antibodies: LIS, anti-DdLIS1; DdCP, anti-DdCP224 mAb 2/165 for immunoblot staining and polyclonal anti-DdCP224 for immunoprecipitation; DHC, antidynein heavy chain Y7; control, anti-rabbit preimmune serum.
Figure 9.
Figure 9.
MBP-DdLIS1 overexpression disrupts radial microtubules arrays. Immunofluorescence labeling of MBP-DdLIS1 overexpressing cells with anti-α-tubulin antibodies (green; A) and anti-MBP antibodies (red; A′ and B′). Nuclei were stained with TOPRO3 (blue). In many cells microtubules show no point-symmetric radial arrangement. Like endogenous DdLIS1 (Figure 2), MBP-DdLIS1 colocalizes with microtubules as revealed by the merged image (C). Cells were fixed with glutaraldehyde. Bar, 5 μm.
Figure 10.
Figure 10.
DdLIS1-D327H cells and MBP-DdLIS1 overexpressors are flatter than usual and display an increase contact surface to the substrate. Living AX2 control cells (Supplementary Movie4), DdLIS-D327H cells (Supplementary Movie5), and MBP-DdLIS1 overexpressors (Supplementary Movie6) were viewed by RICM. RICM images are shown in the lower panel and corresponding bright-field images in the top panel. The dark area in the RICM channel corresponds to the cell's contact surface to the glass substrate. Only a single time point of each movie is shown here.
Figure 11.
Figure 11.
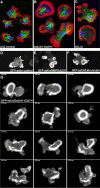
DdLIS1-D327H cells, MBP-DdLIS1 overexpressors, and DICΔC overexpressors often show altered F-actin distribution and alterations in actin dynamics similar to control cells treated with low concentrations of latrunculin A. Immunofluorescence labeling of control cells (A), DdLIS1-D327H cells (B), and DICΔC overexpressors (C) with anti-α-tubulin (green) and phalloidin-AlexaFluor568 (Molecular Probes) as an F-actin labeling probe (red). Nuclei were stained with TOPRO3 (blue). Note the broad F-actin distribution at the bottom of the cells along with disrupted microtubule cytoskeletons in (B and C). Cells were fixed with glutaraldehyde. Bar, 5 μm. Note that phalloidin-labeling intensities in these images do not illustrate the F-actin content, because all images were acquired at microscope settings allowing coverage of the full dynamic range of the 8-bit scale. Live analysis of actin dynamics was performed with GFP-actin control cells (D, Supplementary Movie7), GFP-actin/MBP-DdLIS1 overexpressors (E, Supplementary Movie8), GFP-actin cells treated with 0.2 μM latrunculin A (F, Supplementary Movie9) and GFP-actin cells carrying DdLIS1-D327H mutation (G, Supplementary Movie10). Each image represents a brightest point z-projection of three confocal slices with a distance of 0.8 μm each. One a single, representative time frame of each movie is shown in D–F, whereas G represents a time sequence.
Figure 12.
Figure 12.
The F-actin content in DdLIS1-D327H cells and MBP-DdLIS1 overexpressors is reduced to a similar extent as upon treatment with low concentrations of latrunculin A. The Western blot containing equivalent amounts of F- and G-actin fractions (lanes F and G) from AX2 control cells, AX2 cells treated with 0.2 μM latrunculin A, DdLIS1-D327H cells and MBP-DdLIS1 overexpressors was stained with antiactin antibodies, and enhanced chemiluminescence.
Figure 13.
Figure 13.
DdLIS1 but not MBP-DdLIS1 interacts with Rac1A. Western blots containing equivalent amounts of protein coprecipitated with GST-Rac1A-GTPγS, GST-Rac1A-GDP, or GST alone (control) from a wild-type cell extract (AX2, lanes 1–3), a purified His-tagged DdLIS1 protein solution (lanes 4–6), and an MBP-DdLIS1 cell extract (lanes 7–9) are shown. Blots were stained with anti-DdLIS1 antibodies and enhanced chemiluminescence. Lane 10 shows a sample of the same MPB-DdLIS1 cell extract as in lanes 7–9 and shows the extent of overexpression of MBP-DdLIS1 compared with the endogenous protein. Note that MBP-DdLIS1 bands are missing in lanes 7–9.

Similar articles

Cited by

References

    1. Bretschneider, T., Diez, S., Anderson, K., Heuser, J., Clarke, M., Müller-Taubenberger, A., Köhler, J., and Gerisch, G. (2004). Dynamic actin patterns and Arp2/3 assembly at the substrate-attached surface of motile cells. Curr. Biol. 14, 1–10. - PubMed
    1. Burkhardt, J. K., Echeverri, C. J., Nilsson, T., and Vallee, R. B. (1997). Overexpression of the dynamitin (p50) subunit of the dynactin complex disrupts dynein-dependent maintenance of membrane organelle distribution. J. Cell Biol. 139, 469–484. - PMC - PubMed
    1. Bush, J., Franek, K., and Cardelli, J. (1993). Cloning and characterization of seven novel Dictyostelium discoideum rac-related genes belonging to the rho family of GTPases. Gene 136, 61–68. - PubMed
    1. Caspi, M., Atlas, R., Kantor, A., Sapir, T., and Reiner, O. (2000). Interaction between LIS1 and doublecortin, two lissencephaly gene products. Hum. Mol. Genet. 9, 2205–2213. - PubMed
    1. Caspi, M., Coquelle, F. M., Koifman, C., Levy, T., Arai, H., Aoki, J., De Mey, J. R., and Reiner, O. (2003). LIS1 missense mutations: variable phenotypes result from unpredictable alterations in biochemical and cellular properties. J. Biol. Chem. 278, 38740–38748. - PubMed

Publication types

MeSH terms

LinkOut - more resources