Comparative Study
. 2005 Mar 16;25(11):2983-91.
doi: 10.1523/JNEUROSCI.4906-04.2005.

Stimulus-dependent changes in spike threshold enhance feature selectivity in rat barrel cortex neurons

Affiliations
Comparative Study

Stimulus-dependent changes in spike threshold enhance feature selectivity in rat barrel cortex neurons

W Bryan Wilent et al. J Neurosci. .

Abstract

Feature selectivity is a fundamental property of sensory cortex neurons, yet the mechanisms underlying its genesis are not fully understood. Using intracellular recordings in vivo from layers 2-6 of rat barrel cortex, we studied the selectivity of neurons to the angular direction of whisker deflection. The spike output and the underlying synaptic response decreased exponentially in magnitude as the direction of deflection diverged from the preferred. However, the spike output was more sharply tuned for direction than the underlying synaptic response amplitude. This difference in selectivity was attributable to the rectification imposed by the spike threshold on the input-output function of cells. As in the visual system, spike threshold was not constant and showed trial-to-trial variability. However, here we show that the mean spike threshold was direction dependent and increased as the direction diverged from the preferred. Spike threshold was also related to the rate of rise of the synaptic response, which was direction dependent and steepest for the preferred direction. To assess the impact of the direction-dependent changes in spike threshold on direction selectivity, we applied a fixed threshold to the synaptic responses and calculated a predicted spike output. The predicted output was more broadly tuned than the obtained spike response, demonstrating for the first time that the regulation of the spike threshold by the properties of the synaptic response effectively enhances the selectivity of the spike output.


Figures
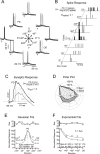
Figure 1.
Figure 1.
Synaptic and spike responses to different directions of whisker deflection. A, Superimposed single trial responses to eight directions (45° intervals) obtained at a moderately depolarized Vm (-64 mV; 0.2 nA) are shown. The dorsorostral direction (135°), which evoked 11 spikes, was the PD, and the OD, 315°, evoked four spikes. Arrows indicate stimulus onset. D, Dorsal; V, ventral; R, rostral; C, caudal. B, Poststimulus spike histograms of the responses to all directions (indicated at right), offset horizontally and vertically for clarity, are shown. The dotted line indicates time of onset of whisker deflection (Stim Onset). The DI for this cell was 2.1. Avg, Average. C, Superimposed average (n = 17) synaptic responses are shown. Vertical dotted lines indicate the peak where the amplitude was measured. The DI for the synaptic response (DIsyn) amplitude was 1.6. Response to the PD (black trace) and the OD (gray trace) are represented as thicker lines to highlight their differences. Stimulus onset time is indicated by the arrow. D, A polar plot of the spike (Spks; circle) and synaptic (Syn; square) response magnitude is shown. The spike response was more sharply tuned. E, The bottom plot shows the response magnitude plotted versus direction fit by a Gaussian function. The HWHH of the fit did not distinguish between the spike and synaptic response amplitude. The top plot shows the residuals (Res) from the fit. F, Response magnitude, plotted as function of angular distance from the PD, was fit with an exponential function, and the decay constant and decay amplitude of the fit were used to determine the selectivity. The spike response was more selective than the synaptic response amplitude. The top plot shows the residuals from the fit.
Figure 2.
Figure 2.
Direction sensitivity of spike and synaptic responses for the population. A, The mean spike response (Spks; DI = 2.18) was significantly (**p < 0.01) more sensitive to the direction of whisker deflection than the mean synaptic response (Syn) amplitude. The mean synaptic response amplitude under depolarization (Dep; Vm = -63 mV; I range, 0.1-0.3 nA; DI = 1.78) was significantly (*p < 0.05) more sensitive than the mean response at rest (Vm = -72 mV; DI = 1.42) or under hyperpolarization (Hyp; Vm = -81 mV; I range, -0.2-0.5 nA; DI = 1.47). Values are mean ± SE. B, A plot of DI of the spike response versus the synaptic response at rest for each cell shows that all points except one are above the main diagonal. The filled circle indicates the average DI of the spikes and synaptic response. C, A histogram of the distribution of direction indices for the spike and synaptic responses is shown.
Figure 3.
Figure 3.
Direction tuning of the whole population. A, A population polar plot of the spike and synaptic responses, at depolarized (Dep), resting (Rest), and hyperpolarized (Hyp) Vms, normalized to the PD, is shown. Polar plots artificially aligned to 180°. B, Exponential fits of the population data plotted as function of distance from the PD are shown. Values are mean ± SE. The selectivity of the spike response (S = 1.64) was significantly higher (p < 0.05) than the synaptic response amplitude (Dep, S = 0.78; rest, S = 0.58; Hyp, S = 0.57). Residuals are shown in the top plot.
Figure 4.
Figure 4.
Spike threshold and the preceding dVm/dt. A, The spike threshold (Thr) was determined as the Vm from baseline at the time of the peak of the second derivative. B, A PD- (black) and OD- (gray) evoked spike are shown. The rate of rise preceding the PD spike was 1 mV/ms greater than that of the OD-evoked spike, and the spike threshold of the PD was 2.0 mV lower than that of the OD-evoked spike (vertical arrows). The inset shows the final 2.5 ms of the synaptic response leading to a spike, the time period in which dVm/dt was determined. C, Threshold and dVm/dt of all OD- and PD-evoked spikes are shown. The spike threshold of PD-evoked spikes was significantly lower, and the dVm/dt was significantly higher than that of OD-evoked spikes (mean ± SE). D, Threshold versus dVm/dt for spontaneous spikes from three example cells, including the cell shown in B (cell 1).
Figure 5.
Figure 5.
Relationship of spike threshold and dVm/dt for the population. A, The distribution of the dVm/dt of all evoked spikes [mean (avg) ± SE = 2.1 ± 0.04 mV/ms] is shown. B, The amount of depolarization required to reach spike threshold increased as the deflection direction moved away from PD. PD trials required significantly (*p < 0.05) less depolarization than the OD and directions 90 and 135° away from the PD. C, The dVm/dt preceding a spike decreased as the direction deviated from the PD. The dVm/dt preceding PD-evoked spikes (2.5 mV/ms) was significantly higher than the dVm/dt preceding spikes evoked by the OD (1.78 mV/ms) and directions 90° (1.95 mV/ms) and 135° (1.80 mV/ms) away from the PD. Error bars in B and C indicate SE. D, The relationship between spike threshold and dVm/dt showed a negative correlation.
Figure 6.
Figure 6.
The effect of a varying spike threshold on the number of suprathreshold trials. A, At left, superimposed responses to the OD (n = 21) showing suprathreshold trials that generated spikes (n = 6 trials, n = 6 spikes; black), trials that crossed threshold (Thr) but did not generate spikes (n = 4), and subthreshold trials (n = 11). At right, superimposed responses to the PD (n = 21) showing suprathreshold trials that generated spikes (n = 16 trials, n = 18 spikes; black), trials that crossed threshold but did not generate spikes (n = 1; red), and subthreshold trials (n = 4; blue) [average (avg) Vm = -60 mV; I = 0.2 nA]. Averages are shown in the insets. B, The left histogram shows the spikes per stimulus (Spks/Stm) for the OD and the PD for this cell. The OD was 34% of the value of the PD. The middle histogram illustrates the number of trials per stimulus in which a spike was evoked (suprathreshold per stimulus observed). The OD was 35% of the PD, which is similar to the number of spikes per stimulus, because all but two suprathreshold trials evoked only a single spike. The right histogram shows the number of suprathreshold trials per stimulus predicted using a fixed threshold (this includes trials that crossed threshold but did not generate a spike; red traces in A). The difference between directions is considerably smaller (OD = 58% of PD), showing that a variable threshold enhances direction selectivity.
Figure 7.
Figure 7.
Comparison between obtained and predicted suprathreshold trials per stimulus for the population. A, Population polar plots showing the sharpening in tuning of the obtained suprathreshold trials (open black circles) compared with the number predicted using a fixed threshold (filled black circles). B, Exponential fits to the obtained and predicted responses indicated that the selectivity of the obtained responses (S = 1.55) was significantly higher (*p < 0.05) than that of the predicted responses (S = 0.98). Values are mean ± SE. In both A and B, the selectivity of the population spike output (gray circles) and the synaptic response amplitude (triangles) are shown (data from Fig. 3).

Similar articles

Cited by

References

    1. Alonso JM, Usrey WM, Reid RC (1996) Precisely correlated firing in cells of the lateral geniculate nucleus. Nature 383: 815-819. - PubMed
    1. Axmacher N, Miles R (2004) Intrinsic cellular currents and the temporal precision of EPSP-action potential coupling in CA1 pyramidal cells. J Physiol (Lond) 555: 713-725. - PMC - PubMed
    1. Azouz R, Gray CM (2000) Dynamic spike threshold reveals a mechanism for synaptic coincidence detection in cortical neurons in vivo. Proc Natl Acad Sci USA 97: 8110-8115. - PMC - PubMed
    1. Azouz R, Gray CM (2003) Adaptive coincidence detection and dynamic gain control in visual cortical neurons in vivo. Neuron 37: 513-523. - PubMed
    1. Bonds AB (1989) Role of inhibition in the specification of orientation selectivity of cells in the cat striate cortex. Vis Neurosci 2: 41-55. - PubMed

Publication types

LinkOut - more resources