. 2005 Jun;16(6):2719-33.
doi: 10.1091/mbc.e04-08-0676. Epub 2005 Mar 16.

Effects of {gamma}-tubulin complex proteins on microtubule nucleation and catastrophe in fission yeast

Affiliations

Effects of {gamma}-tubulin complex proteins on microtubule nucleation and catastrophe in fission yeast

Sabina Zimmerman et al. Mol Biol Cell. 2005 Jun.

Abstract

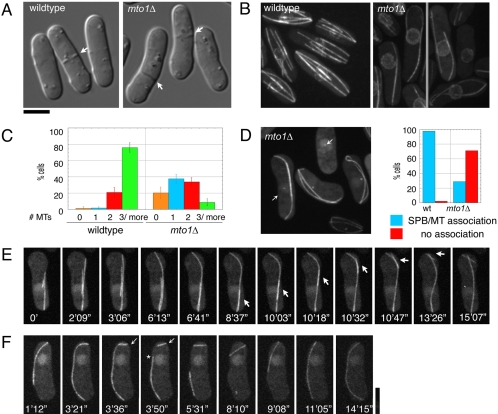
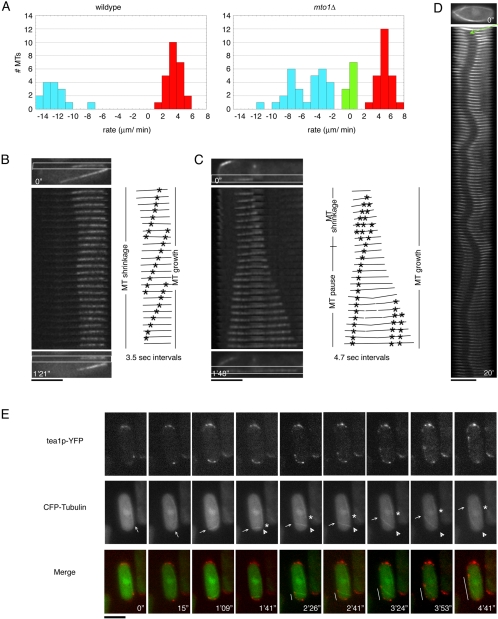
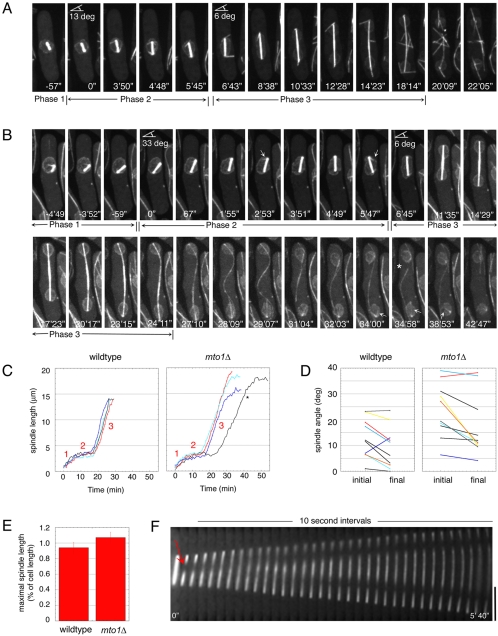
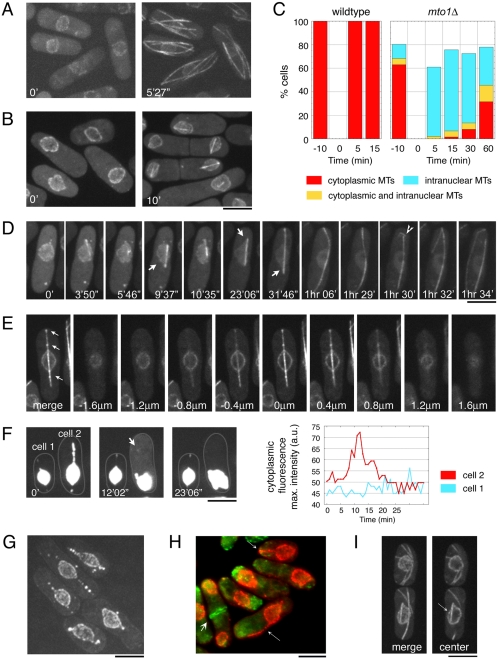
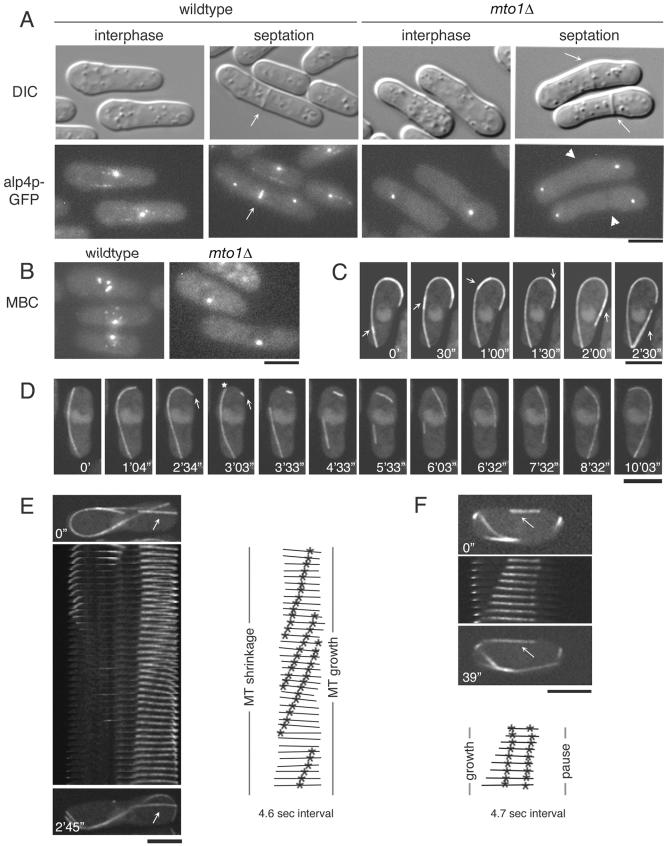
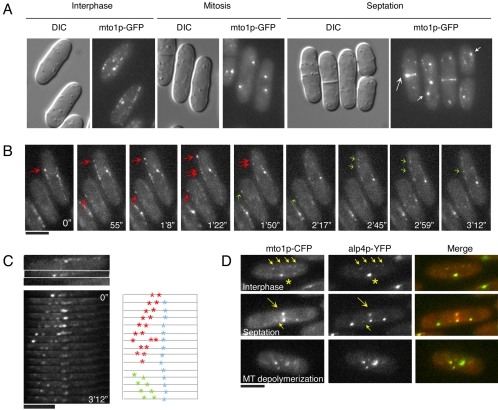
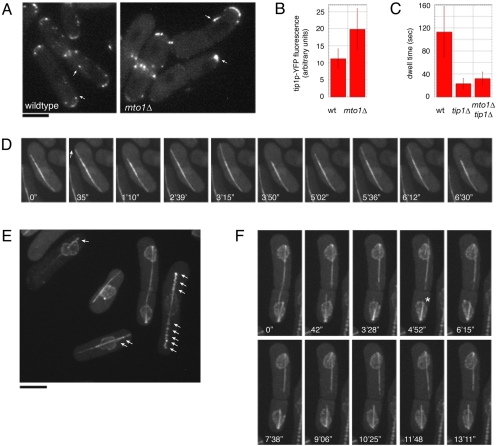
Although gamma-tubulin complexes (gamma-TuCs) are known as microtubule (MT) nucleators, their function in vivo is still poorly defined. Mto1p (also known as mbo1p or mod20p) is a gamma-TuC-associated protein that recruits gamma-TuCs specifically to cytoplasmic MT organizing centers (MTOCs) and interphase MTs. Here, we investigated gamma-TuC function by analyzing MT behavior in mto1Delta and alp4 (GCP2 homologue) mutants. These cells have free, extra-long interphase MTs that exhibit abnormal behaviors such as cycles of growth and breakage, MT sliding, treadmilling, and hyperstability. The plus ends of interphase and spindle MTs grow continuously, exhibiting catastrophe defects that are dependent on the CLIP170 tip1p. The minus ends of interphase MTs exhibit shrinkage and pauses. As mto1Delta mutants lack cytoplasmic MTOCs, cytoplasmic MTs arise from spindle or other intranuclear MTs that exit the nucleus. Our findings show that mto1p and gamma-TuCs affect multiple properties of MTs including nucleation, nuclear attachment, plus-end catastrophe, and minus-end shrinkage.


Figures

Figure 1.
Figure 1.
mto1Δ cells have defects in MT organization. (A) Differential interference contrast (DIC) images of wild-type (FC421) and mto1Δ (FC1189) cells. Arrows indicate septum position. (B–F) Cells expressing GFP-α-tubulin (pDQ105; GFP-atb2p) were imaged by 3D confocal fluorescence microscopy in multiple focal planes. (B) Maximum projection images of nup107p-GFP (FC1025) and cut11p-GFPmto1Δ (FC1203). (C) Number of interphase MTs in wild-type (FC1193; n = 319) and mto1Δ (FC1192; n = 467). (D) mto1Δ alp4p-GFP (FC1192) cells expressing GFP-α-tubulin were imaged (left). Arrows point to SPBs. SPB-MT association was quantified in interphase wild-type (FC1193) and mto1Δ (FC1102) cells expressing GFP-α-tubulin and alp4p-GFP as a SPB marker (right). An association was counted if the SPB overlapped an MT for two time points 120 s apart (n > 160). (E) Time-lapse images of an mto1Δ cell (FC1204) in which an MT slides along another MT (arrow). (F) Time-lapse images of MT growth around the cell tip and subsequent breakage in a mto1Δ cell. Arrow marks MT growing tip, and asterisk refers to the MT break. Scale bars, 5 μm.
Figure 2.
Figure 2.
Abnormal MT dynamics in mto1Δ mutant cells. (A) Interphase MT growth and shrinkage rates were measured in single focal planes by fluorescence speckle microscopy (see Materials and Methods) of wild-type (FC1025) and mto1Δ cells (FC1204, FC1193) expressing GFP-α-tubulin. Positive rates (red) represent MT growth, negative rates (blue) represent MT shrinkage, and zero rates (green) represent MT pauses. (B and C) Examples of MT treadmilling and pausing, as shown by location of MT ends relative to GFP-α-tubulin speckles in mto1Δ cells (FC1204, B; FC1193, C). Kymographs show confocal images in a single focal plane of an MT (box) over time. Line drawings illustrate the behavior of the MTs marked with representative speckles. (D) Kymograph showing the behavior of a stable photobleach mark (arrow) on an MT bundle in mto1Δ cell (FC1204). Images are taken 10 s apart. (E) Time-lapse of mto1Δ cells expressing tea1p-YFP and CFP-tubulin (FC1198). Arrows in CFP-tubulin refer to the MT plus end marked by tea1p and arrowheads denote the predicted MT minus end lacking tea1p. The asterisk marks the site of MT breakage and then the shrinking MT (the predicted plus end). Lines in Merge panels mark tea1p-YFP dots deposited along cell cortex. Scale bars, 5 μm.
Figure 3.
Figure 3.
Mto1p regulates the assembly of astral and eMTOC MTs and the disassembly of spindle MTs. Wild-type (FC1025) and mto1Δ (FC1203 or FC1204) cells expressing GFP-tubulin and either nup107p-GFP (wild-type) or cut11p-GFP (mto1Δ; FC1203) were imaged by 3D confocal microscopy at 29°C. (A) Normal spindle in wild-type cell (FC1025). (B) Spindle in mto1Δ cell. Note the absence of anaphase astral MTs and eMTOC MTs. The asterisk marks spindle breakage, and arrows refer to intranuclear MTs. (C) Spindle elongation in four representative wild-type and mto1Δ cells. The asterisk marks one of two spindles (n = 13) that elongated at a slower rate than wild type. mto1Δ spindles persist over time. (D) Changes in spindle orientation over Phase 2 (metaphase/anaphase A) in representative cells. (E) Quantitation of the spindle length at the time of spindle breakdown. (F) Kymograph of an mto1Δ spindle that was photobleached in the middle in early anaphase (arrow). Scale bars, 5 μm.
Figure 4.
Figure 4.
Abnormal MT nucleation in the mto1Δ mutant. MTs in wild-type (FC1025) and mto1Δ (FC1203) cells expressing GFP-α-tubulin and nuclear pore markers were depolymerized by a 20-min treatment at 0°C and were monitored for MT regrowth upon shift to 25°C. (A) Images of wild-type cells at indicated times after cold shock. (B) Images of mto1Δ cells at indicated times after cold shock. (C) Characterization of MT types that develop after cold shock in nonseptated interphase cells (n > 50 cells at each time point). (D) Time-lapse images of an mto1Δ cell. Arrows mark stretching of the nuclear envelope during MT growth and arrowhead indicates the entry of an intranuclear MT into the cytoplasm. (E) Z-sections of an mto1Δ cell expressing GFP-α-tubulin and a nuclear pore marker cut11p-GFP 30 min after cold shock. Sections show that the MT bundle resides inside the nuclear envelope. Note the presence of nuclear pores (dots marked by cut11p-GFP) on the sides of the MT bundle (arrows). (F) Time-lapse images of two cells expressing cut11p-GFP and a soluble NLS-GFP-βgal marker (FC1226). In each cell, maximum cytoplasmic fluorescence intensity was measured at a point adjacent to the nucleus and plotted in the graph to the right. The increase, at 12′02″, in cytoplasmic fluorescence intensity in cell 2 (arrow) indicates a transient breakage of the nuclear envelope. (G) mto1Δ cells expressing the nuclear pore marker cut11p-GFP (FC1200) after 30 min of recovery after cold shock. (H) F-actin staining (green) of mto1Δ cells expressing cut11p-GFP (red; FC1200) after 30 min of recovery after cold shock. Small arrows show abnormal projections of the nuclear envelope in interphase cells without actin rings. Large arrow marks dividing cell with actin ring and no nuclear projections. (I) Intranuclear MT (arrow) in mto1Δ cells expressing GFP-α-tubulin and cut11p-GFP (FC1203) without cold shock. Maximum intensity projection (left) and a single focal plane (right) are shown. Scale bars, 5 μm.
Figure 5.
Figure 5.
Localization and mutant phenotype of the γ-tubulin complex protein alp4p. (A and B) Cells expressing alp4p-GFP were imaged in multiple focal planes by wide-field microscopy in wild-type (FC1191) or mto1Δ (FC1190) cells. Alp4p-GFP localization was analyzed throughout the cell cycle (A) and after MBC treatment (B). Arrows refer to the septum or eMTOC, and arrowheads mark the position where eMTOCs should form. (C–F) alp4-1891 cells expressing GFP-Tubulin (FC1199) were grown at 30°C and imaged in multiple (C and D) or single (E and F) focal planes by confocal microscopy. (C) Time-lapse imaging of MT sliding in alp4-1891 cell. Arrows refer to the sliding MT bundle. (D) Time-lapse imaging of MT snapping and elongation in the alp4-1891 mutant. The arrow marks the tip of the original MT, and the asterisk (*) marks the site of MT breakage. (E and F) Kymographs demonstrating (E) MT treadmilling and (F) MT pause in the alp4-1891 mutant. Arrows highlights the MT analyzed. Models adjacent to the kymograph mark representative speckles (*). Scale bars, 5 μm.
Figure 6.
Figure 6.
Mto1p localization to MTOCs and satellites. (A) mto1p-GFP localization in different cell cycle stages. Maximum intensity projections of confocal images are shown. Large arrow marks the eMTOC, and smaller arrows point to SPBs. (B) Time-lapse images of mto1p-GFP satellites moving in the predicted MT plus direction toward the cell tips (red arrows) and in the predicted MT minus direction toward the nucleus (green arrows; FC1188). Images were taken in a single focal plane. (C) Kymograph showing mto1p-GFP satellite behavior on an MT bundle (box). Line drawing shows representative behaviors of individual satellites. Red asterisks mark satellites moving in the plus direction, green asterisks denote the minus direction, and blue asterisks refer to satellites that move little. (D) Colocalization of mto1p-CFP and alp4p-YFP (FC1194) at satellites (small yellow arrows), SPB (asterisks), eMTOC (large yellow arrows), and iMTOCs (MBC-treated cells) in single focal planes. Scale bars, 5 μm.
Figure 7.
Figure 7.
γ-TuCs affect the regulation of tip1p (CLIP170 homologue). (A) Tip1p-YFP localization in wild-type (FC1228) and in mto1Δ (FC1227) cells. Cells were imaged in multiple focal planes by wide-field microscopy. Arrows mark dots of tip1p that are likely to be at MT plus ends. (B) Quantification of fluorescence intensity of tip1p-YFP dots that are likely to be at MT plus ends. Measurements were obtained from single focal planes from images such as those in A. (C) Quantification of dwell time in wild-type (FC1025), tip1Δ (FC1230), and mto1Δtip1Δ (FC1229) double mutants. (D) 3D confocal time-lapse images of MT growth and catastrophe from a single MT bundle in mto1Δtip1Δ (FC1229). The top portion of the MT bundle (arrow) is dynamic, whereas the lower portion is not. (E and F) Maximum intensity projections of confocal images of mto1Δtip1Δ cells expressing cut11p-GFP (nuclear pore marker) and GFP-tubulin (FC1232). (E) Arrows mark examples of nuclear pores spread along projecting MT bundle (see Supplementary Movie 13). (F) Time-lapse images of the spindle and other intranuclear MTs during cell division. One of the half spindles (top cell) persists as a projecting, dynamic MT bundle. The other half spindle (in bottom cell) shrinks, and a nonspindle intranuclear MT (asterisk) projects out of the nucleus. Scale bars, 5 μm.

Similar articles

Cited by

References

    1. Bahler, J., Wu, J. Q., Longtine, M. S., Shah, N. G., McKenzie, A., 3rd, Steever, A. B., Wach, A., Philippsen, P., and Pringle, J. R. (1998). Heterologous modules for efficient and versatile PCR-based gene targeting in Schizosaccharomyces pombe. Yeast 14, 943–951. - PubMed
    1. Behrens, R., and Nurse, P. (2002). Roles of fission yeast tea1p in the localization of polarity factors and in organizing the microtubular cytoskeleton. J. Cell Biol. 157, 783–793. - PMC - PubMed
    1. Brunner, D., and Nurse, P. (2000). CLIP170-like tip1p spatially organizes microtubular dynamics in fission yeast. Cell 102, 695–704. - PubMed
    1. Chen, C. R., Li, Y. C., Chen, J., Hou, M. C., Papadaki, P., and Chang, E. C. (1999). Moe1, a conserved protein in Schizosaccharomyces pombe, interacts with a Ras effector, Scd1, to affect proper spindle formation. Proc. Natl. Acad. Sci. USA 96, 517–522. - PMC - PubMed
    1. Chretien, D., and Fuller, S. D. (2000). Microtubules switch occasionally into unfavorable configurations during elongation. J. Mol. Biol. 298, 663–676. - PubMed

Publication types

MeSH terms