Consequences of immunodominant epitope deletion for minor influenza virus-specific CD8+-T-cell responses
- PMID: 15767433
- PMCID: PMC1061524
- DOI: 10.1128/JVI.79.7.4329-4339.2005
Consequences of immunodominant epitope deletion for minor influenza virus-specific CD8+-T-cell responses
Abstract
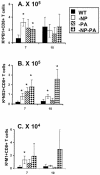
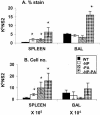
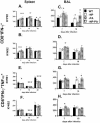
The extent to which CD8+ T cells specific for other antigens expand to compensate for the mutational loss of the prominent DbNP366 and DbPA224 epitopes has been investigated using H1N1 and H3N2 influenza A viruses modified by reverse genetics. Significantly increased numbers of CD8+ KbPB1(703)+, CD8+ KbNS2(114)+, and CD8+ DbPB1-F2(62)+ T cells were found in the spleen and in the inflammatory population recovered by bronchoalveolar lavage from mice that were first given the -NP-PA H1N1 virus intraperitoneally and then challenged intranasally with the homologous H3N2 virus. The effect was less consistent when this prime-boost protocol was reversed. Also, though the quality of the response measured by cytokine staining showed some evidence of modification when these minor CD8+-T-cell populations were forced to play a more prominent part, the effects were relatively small and no consistent pattern emerged. The magnitude of the enhanced clonal expansion following secondary challenge suggested that the prime-boost with the -NP-PA viruses gave a response overall that was little different in magnitude from that following comparable exposure to the unmanipulated viruses. This was indeed shown to be the case when the total response was measured by ELISPOT analysis with virus-infected cells as stimulators. More surprisingly, the same effect was seen following primary challenge, though individual analysis of the CD8+ KbPB1(703)+, CD8+ KbNS2(114)+, and CD8+ DbPB1-F2(62)+ sets gave no indication of compensatory expansion. A possible explanation is that novel, as yet undetected epitopes emerge following primary exposure to the -NP-PA deletion viruses. These findings have implications for both natural infections and vaccines.
Figures


Similar articles
-
A previously unrecognized H-2D(b)-restricted peptide prominent in the primary influenza A virus-specific CD8(+) T-cell response is much less apparent following secondary challenge.J Virol. 2000 Apr;74(8):3486-93. doi: 10.1128/jvi.74.8.3486-3493.2000. J Virol. 2000. PMID: 10729122 Free PMC article.
-
Hidden epitopes emerge in secondary influenza virus-specific CD8+ T cell responses.J Immunol. 2007 Mar 1;178(5):3091-8. doi: 10.4049/jimmunol.178.5.3091. J Immunol. 2007. PMID: 17312156
-
Addition of a prominent epitope affects influenza A virus-specific CD8+ T cell immunodominance hierarchies when antigen is limiting.J Immunol. 2006 Sep 1;177(5):2917-25. doi: 10.4049/jimmunol.177.5.2917. J Immunol. 2006. PMID: 16920927
-
Characterization of CD8+ T cell repertoire diversity and persistence in the influenza A virus model of localized, transient infection.Semin Immunol. 2004 Jun;16(3):179-84. doi: 10.1016/j.smim.2004.02.005. Semin Immunol. 2004. PMID: 15130502 Review.
-
Quantitative analysis of the CD8+ T-cell response to readily eliminated and persistent viruses.Philos Trans R Soc Lond B Biol Sci. 2000 Aug 29;355(1400):1093-101. doi: 10.1098/rstb.2000.0647. Philos Trans R Soc Lond B Biol Sci. 2000. PMID: 11186311 Free PMC article. Review.
Cited by
-
Primary vascularization of the graft determines the immunodominance of murine minor H antigens during organ transplantation.J Immunol. 2011 Oct 15;187(8):3997-4006. doi: 10.4049/jimmunol.1003918. Epub 2011 Sep 7. J Immunol. 2011. PMID: 21900176 Free PMC article.
-
Analysis of the evolutionary forces in an immunodominant CD8 epitope in hepatitis C virus at a population level.J Virol. 2008 Apr;82(7):3438-51. doi: 10.1128/JVI.01700-07. Epub 2008 Jan 23. J Virol. 2008. PMID: 18216107 Free PMC article.
-
Influence of an immunodominant herpes simplex virus type 1 CD8+ T cell epitope on the target hierarchy and function of subdominant CD8+ T cells.PLoS Pathog. 2017 Dec 4;13(12):e1006732. doi: 10.1371/journal.ppat.1006732. eCollection 2017 Dec. PLoS Pathog. 2017. PMID: 29206240 Free PMC article.
-
Mapping Influenza-Induced Posttranslational Modifications on Histones from CD8+ T Cells.Viruses. 2020 Dec 8;12(12):1409. doi: 10.3390/v12121409. Viruses. 2020. PMID: 33302437 Free PMC article.
-
Trivalent live attenuated influenza-simian immunodeficiency virus vaccines: efficacy and evolution of cytotoxic T lymphocyte escape in macaques.J Virol. 2013 Apr;87(8):4146-60. doi: 10.1128/JVI.02645-12. Epub 2013 Jan 23. J Virol. 2013. PMID: 23345519 Free PMC article.
References
-
- Allan, W., Z. Tabi, A. Cleary, and P. C. Doherty. 1990. Cellular events in the lymph node and lung of mice with influenza. Consequences of depleting CD4+ T cells. J. Immunol. 144:3980-3986. - PubMed
-
- Banchereau, J., S. Paczesny, P. Blanco, L. Bennett, V. Pascual, J. Fay, and A. K. Palucka. 2003. Dendritic cells: controllers of the immune system and a new promise for immunotherapy. Ann. N. Y. Acad. Sci. 987:180-187. - PubMed
-
- Belz, G. T., W. Xie, and P. C. Doherty. 2001. Diversity of epitope and cytokine profiles for primary and secondary influenza A virus-specific CD8+ T cell responses. J. Immunol. 166:4627-4633. - PubMed
-
- Boon, A. C., G. de Mutsert, Y. M. Graus, R. A. Fouchier, K. Sintnicolaas, A. D. Osterhaus, and G. F. Rimmelzwaan. 2002. Sequence variation in a newly identified HLA-B35-restricted epitope in the influenza A virus nucleoprotein associated with escape from cytotoxic T lymphocytes. J. Virol. 76:2567-2572. - PMC - PubMed
Publication types
MeSH terms
Substances
Grants and funding
LinkOut - more resources
Full Text Sources
Other Literature Sources
Molecular Biology Databases
Research Materials
Miscellaneous

