. 2005 Mar 21;201(6):859-70.
doi: 10.1084/jem.20041891. Epub 2005 Mar 14.

Regulation of anaphylactic responses by phosphatidylinositol phosphate kinase type I {alpha}

Affiliations

Regulation of anaphylactic responses by phosphatidylinositol phosphate kinase type I {alpha}

Junko Sasaki et al. J Exp Med. .

Abstract

The membrane phospholipid phosphatidylinositol 4, 5-bisphosphate [PI(4,5)P(2)] is a critical signal transducer in eukaryotic cells. However, the physiological roles of the type I phosphatidylinositol phosphate kinases (PIPKIs) that synthesize PI(4,5)P(2) are largely unknown. Here, we show that the alpha isozyme of PIPKI (PIPKIalpha) negatively regulates mast cell functions and anaphylactic responses. In vitro, PIPKIalpha-deficient mast cells exhibited increased degranulation and cytokine production after Fcepsilon receptor-I cross-linking. In vivo, PIPKIalpha(-/-) mice displayed enhanced passive cutaneous and systemic anaphylaxis. Filamentous actin was diminished in PIPKIalpha(-/-) mast cells, and enhanced degranulation observed in the absence of PIPKIalpha was also seen in wild-type mast cells treated with latrunculin, a pharmacological inhibitor of actin polymerization. Moreover, the association of FcepsilonRI with lipid rafts and FcepsilonRI-mediated activation of signaling proteins was augmented in PIPKIalpha(-/-) mast cells. Thus, PIPKIalpha is a negative regulator of FcepsilonRI-mediated cellular responses and anaphylaxis, which functions by controlling the actin cytoskeleton and dynamics of FcepsilonRI signaling. Our results indicate that the different PIPKI isoforms might be functionally specialized.


Figures

Figure 1.
Figure 1.
Gene targeting of murine PIPKIα and characterization of PIPKIα2/− BMMCs. (A) Partial restriction map of the genomic PIPKIα sequence and construction of the targeting vector bearing the neomycin resistance (Neo r) gene. Exon 3, which encodes a portion of the kinase core domain, was replaced with a PGK-Neo cassette. The PIPKIα flanking probe used for Southern blotting and expected fragment sizes after digestion of WT and mutant genomic DNA are indicated. H, Hind III; E, EcoRV; S, SmaI; DT-A, diphtheria toxin A subunit. (B) Southern blot of genomic DNA from wild type (+/+), PIPKIα+/− (+/−), and PIPKIα−/− (−/−) E14 embryonic stem cells hybridized to the probe indicated in A. (C) Western blot of PIPKI isozyme expression in BMMCs using antibodies specifically recognizing the indicated proteins. (D) Flow cytometric analysis of the normal surface expression of c-Kit (left) and FcɛRI (right) on PIPKIα−/− BMMCs. (E) Equivalent cumulative cell numbers of PIPKIα+/+ (open circles) and PIPKIα−/− BMMCs (closed circles, dotted line) in cultures maintained for the indicated number of days. For all figures, results shown are representative of at least three independent experiments using three pairs of simultaneously established PIPKIα+/+ and PIPKIα−/− BMMCs.
Figure 2.
Figure 2.
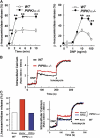
Enhanced FcɛRI-mediated degranulation and calcium mobilization in PIPKIα2/− mast cells. (A) Increased β-hexosaminidase release. PIPKIα+/+ (WT; open circles) and PIPKIα−/− (closed circles) BMMCs were preloaded with mouse anti-DNP IgE and stimulated with 50 ng/ml−1 DNP-HSA for the indicated times (left) or stimulated for 10 min with the indicated concentrations of DNP-HSA (right). The percentage of total cellular β-hexosaminidase that was released was taken as degranulation. Data shown are the mean ± SD of triplicate samples. **, P < 0.01 for PIPKIα−/− cells compared with PIPKIα+/+ cells, as determined by Student's t test. (B) Increased calcium mobilization. IgE-sensitized, Fura-2-loaded BMMCs were stimulated with 50 ng/ml−1 DNP-HSA and Ca2+ flux was monitored by spectrofluorimetry. (C) Restoration of normal degranulation and Ca2+ flux after introduction of PIPKIα cDNA. Degranulation (left) and Ca2+ flux (right) were measured as in A and B, respectively, in WT BMMCs or PIPKIα−/− BMMCs reconstituted with either empty vector (red) or PIPKIα cDNA (blue).
Figure 3.
Figure 3.
Augmented cytokine gene expression and FcɛRI signaling in PIPKIα2/− BMMCs. (A) Increased cytokine mRNA expression. PIPKIα+/+ and PIPKIα−/− BMMCs were sensitized with IgE and stimulated with DNP (50 ng/ml−1) for the indicated times. Induction of mRNA expression for the indicated cytokines was detected by RT-PCR. (B) Enhanced signaling molecule phosphorylation after FcɛRI cross-linking. BMMCs were sensitized with IgE and stimulated with DNP for the indicated times. For both panels, 30 μg of cell lysates were subjected to successive rounds of immunoblotting using phospho-specific and total antibodies recognizing the indicated proteins. Syk phosphorylation was monitored by immunoprecipitation of Syk followed by immunoblotting using antiphosphotyrosine antibody. One trial representative of a minimum of three experiments is shown in each case. White lines indicate that intervening lanes have been spliced out. (C) Band intensities in B were quantified using Dolphin-1 software, and relative phosphorylation levels were normalized to protein levels as described in Materials and methods. Values shown are the fold increase in the phosphorylated form of each molecule in PIPKIα−/− BMMCs compared with the value in WT cells activated for 2 min (except for SAPK, which was 10 min). (D) Normal signaling molecule phosphorylation after IL-3 or SCF stimulation. WT and PIPKIα−/− BMMCs were stimulated with either 30 ng/ml−1 IL-3 or 30 ng/ml−1 SCF and the phosphorylation of ERK and p38 was assessed as in B.
Figure 4.
Figure 4.
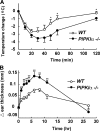
Enhanced anaphylactic responses in PIPKIα−/− mice. (A) Systemic anaphylaxis. WT and PIPKIα−/− mice (n = 7 mice per genotype) received 5 μg anti-DNP IgE i.v., followed by stimulation with 1 mg DNP-HSA per mouse. The systemic anaphylactic response was monitored by measuring rectal temperature at the indicated times after antigen injection. (B) Passive cutaneous anaphylaxis. WT and PIPKIα−/− mice (n = 9 per genotype) received 100 μg anti-TNP IgE i.v. After 24 h, mice were epicutaneously challenged with 10 μl 1% picryl chloride on the right ears, and with 10 μl 1% oxazolone on the left ears. Net ear swelling (thickness of the right ear minus that of the left ear) was measured with a caliper at the indicated times. Data are expressed as mean ± SD. *, P < 0.05 and **, P < 0.01 for PIPKIα−/− mice compared with PIPKIα+/+ mice as determined by Student's unpaired t test.
Figure 5.
Figure 5.
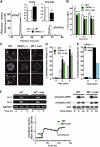
PI(4,5)P2 levels and actin cytoskeleton in PIPKIα−/− BMMCs. (A) Altered phospholipids. HPLC analysis of phospholipids prepared from WT and PIPKIα−/− BMMCs that were metabolically labeled with [3H]inositol for 48 h. The chromatographic tracings shown are one result representative of five independent trials. The decrease in PI(4,5)P2 (0.84-fold) and increase in PI(4)P (1.13-fold) in PIPKIα−/− BMMCs were statistically significant (insets). *, P < 0.05 for PIPKIα−/− cells compared with untreated WT cells. (B) Decreased F-actin content as determined by flow cytometry. IgE-sensitized PIPKIα−/− BMMCs and IgE-sensitized WT BMMCs, which were either left untreated or pretreated with 0.5 μM latrunculin (Latr) for 15 min, were stimulated with 50 ng/ml−1 DNP for the indicated times. F-actin was stained with Alexa 488–labeled phalloidin and analyzed by flow cytometry. The mean channel fluorescence (MCF) in untreated WT BMMCs was arbitrarily assigned a value of 100. Data shown are the mean percentage of the control value ± SD of triplicate samples. *, P < 0.05 for PIPKIα−/− cells or latrunculin-treated WT cells compared with untreated WT cells at the indicated times. (C) Decreased F-actin content as determined by confocal fluorescence microscopy. F-actin in the cells examined in B was visualized using Alexa 488–labeled phalloidin. Confocal images were collected every 1 μm, and summation images (top and middle rows) or single images from the center of representative cells (bottom row) are presented. Bar, 10 μm. The WT cells exhibited a more jagged circumferential F-actin structure compared with PIPKIα−/− cells (arrowheads). (D) Increased degranulation induced by latrunculin. IgE-sensitized PIPKIα−/− BMMCs, and IgE-sensitized WT BMMCs that were either left untreated or pretreated with latrunculin (Latr) for 15 min were stimulated with 50 ng/ml−1 DNP for the indicated times. Degranulation was measured as in Fig. 2 A. **, P < 0.01 for latrunculin-treated WT cells or PIPKIα−/− cells compared with untreated WT cells at 5 min after cross-linking (n = 4). (E) Suppression of degranulation induced by jasplakinolide. IgE-sensitized PIPKIα−/− BMMCs that were either left untreated or pretreated with 1μM jasplakinolide (Jasp) for 15 min were stimulated with DNP for 5 min. Degranulation was assessed as for in D. (F) Normal cytokine mRNA expression, signaling molecule phosphorylation, and Ca2+ mobilization in the presence of latrunculin. IgE-sensitized WT BMMCs that were either left untreated or pretreated with latrunculin for 15 min were stimulated with DNP for the indicated times. Cytokine gene expression, protein phosphorylation, and Ca2+ mobilization were determined as in Fig. 3, A and B, and Fig. 2 B, respectively.
Figure 6.
Figure 6.
Regulation of FcɛRI localization to lipid rafts by PIPKIα. (A) Enhanced localization of FcɛRIγ to lipid rafts. BMMCs sensitized with anti-DNP IgE were either left untreated or treated with latrunculin for 15 min. Cells were incubated with or without DNP (stimulation) for 2 min, lysed in 0.5% Triton X-100 buffer, and subjected to sucrose gradient ultracentrifugation to purify lipid rafts. (left) Fractions were separated by SDS-PAGE, transferred to PVDF membranes, and immunoblotted (IB) with anti-FcɛRI γ-chain antibody. Fractions 3 and 4 contain the lipid rafts. (right) The distribution of FcɛRIγ in fractions 3 and 4 was quantitated by densitometric analysis of the immunoblot. (B) Normal distribution of LAT. Fractions from A were immunoblotted with anti-LAT antibody as for in A (right) and LAT distribution was densitometrically quantitated as in A (left).
Figure 7.
Figure 7.
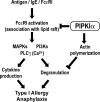
A model for the role of PIPKIα in mast cell activation and anaphylactic responses mediated by FcɛRI. PIPKIα acts both to control FcɛRI signaling after cross-linking and to promote actin polymerization, thereby inhibiting both degranulation and cytokine production. Thus, anaphylaxis is prevented.

Similar articles

Cited by

References

    1. Metcalfe, D.D., D. Baram, and Y.A. Mekori. 1997. Mast cells. Physiol. Rev. 77:1033–1079. - PubMed
    1. Kinet, J.P. 1999. The high-affinity IgE receptor (FcɛRI): from physiology to pathology. Annu. Rev. Immunol. 17:931–972. - PubMed
    1. Galli, S.J. 2000. Mast cells and basophils. Curr. Opin. Hematol. 7:32–39. - PubMed
    1. Turner, H., and J.P. Kinet. 1999. Signalling through the high-affinity IgE receptor FcɛRI. Nature. 402:B24–B30. - PubMed
    1. Zhang, J., E.H. Berenstein, R.L. Evans, and R.P. Siraganian. 1996. Transfection of Syk protein tyrosine kinase reconstitutes high affinity IgE receptor-mediated degranulation in a Syk-negative variant of rat basophilic leukemia RBL-2H3 cells. J. Exp. Med. 184:71–79. - PMC - PubMed

Publication types

MeSH terms