Nanopore unitary permeability measured by electrochemical and optical single transporter recording
- PMID: 15749773
- PMCID: PMC1305631
- DOI: 10.1529/biophysj.104.058255
Nanopore unitary permeability measured by electrochemical and optical single transporter recording
Abstract
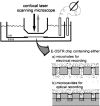
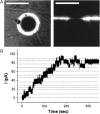
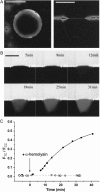
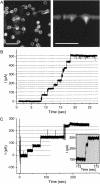
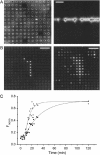
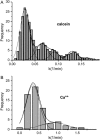
For the analysis of membrane transport processes two single molecule methods are available that differ profoundly in data acquisition principle, achievable information, and application range: the widely employed electrical single channel recording and the more recently established optical single transporter recording. In this study dense arrays of microscopic horizontal bilayer membranes between 0.8 microm and 50 microm in diameter were created in transparent foils containing either microholes or microcavities. Prototypic protein nanopores were formed in bilayer membranes by addition of Staphylococcus aureus alpha-hemolysin (alpha-HL). Microhole arrays were used to monitor the formation of bilayer membranes and single alpha-HL pores by confocal microscopy and electrical recording. Microcavity arrays were used to characterize the formation of bilayer membranes and the flux of fluorescent substrates and inorganic ions through single transporters by confocal microscopy. Thus, the unitary permeability of the alpha-HL pore was determined for calcein and Ca(2+) ions. The study paves the way for an amalgamation of electrical and optical single transporter recording. Electro-optical single transporter recording could provide so far unresolved kinetic data of a large number of cellular transporters, leading to an extension of the nanopore sensor approach to the single molecule analysis of peptide transport by translocases.
Figures
Similar articles
-
Urea denaturation of alpha-hemolysin pore inserted in planar lipid bilayer detected by single nanopore recording: loss of structural asymmetry.FEBS Lett. 2007 Jul 24;581(18):3371-6. doi: 10.1016/j.febslet.2007.06.036. Epub 2007 Jun 26. FEBS Lett. 2007. PMID: 17601577
-
Multichannel simultaneous measurements of single-molecule translocation in alpha-hemolysin nanopore array.Anal Chem. 2009 Dec 15;81(24):9866-70. doi: 10.1021/ac901732z. Anal Chem. 2009. PMID: 20000639
-
Imaging alpha-hemolysin with molecular dynamics: ionic conductance, osmotic permeability, and the electrostatic potential map.Biophys J. 2005 Jun;88(6):3745-61. doi: 10.1529/biophysj.104.058727. Epub 2005 Mar 11. Biophys J. 2005. PMID: 15764651 Free PMC article.
-
Interrogating single proteins through nanopores: challenges and opportunities.Trends Biotechnol. 2009 Jun;27(6):333-41. doi: 10.1016/j.tibtech.2009.02.008. Epub 2009 Apr 23. Trends Biotechnol. 2009. PMID: 19394097 Review.
-
Optical single transporter recording: transport kinetics in microarrays of membrane patches.Annu Rev Biophys Biomol Struct. 2003;32:47-67. doi: 10.1146/annurev.biophys.32.110601.142429. Epub 2003 Feb 6. Annu Rev Biophys Biomol Struct. 2003. PMID: 12574067 Review.
Cited by
-
Channel activity of OmpF monitored in nano-BLMs.Biophys J. 2006 Sep 15;91(6):2163-71. doi: 10.1529/biophysj.106.083592. Epub 2006 Jun 16. Biophys J. 2006. PMID: 16782785 Free PMC article.
-
Microfluidic and Nanofluidic Resistive Pulse Sensing: A Review.Micromachines (Basel). 2017 Jun 25;8(7):204. doi: 10.3390/mi8070204. Micromachines (Basel). 2017. PMID: 30400393 Free PMC article. Review.
-
Lytic and non-lytic permeabilization of cardiolipin-containing lipid bilayers induced by cytochrome C.PLoS One. 2013 Jul 22;8(7):e69492. doi: 10.1371/journal.pone.0069492. Print 2013. PLoS One. 2013. PMID: 23894494 Free PMC article.
-
Microtechnologies for membrane protein studies.Anal Bioanal Chem. 2008 Aug;391(8):2695-702. doi: 10.1007/s00216-008-1916-0. Epub 2008 Mar 12. Anal Bioanal Chem. 2008. PMID: 18335213 Free PMC article. Review.
-
Single-channel electrophysiology reveals a distinct and uniform pore complex formed by α-synuclein oligomers in lipid membranes.PLoS One. 2012;7(8):e42545. doi: 10.1371/journal.pone.0042545. Epub 2012 Aug 3. PLoS One. 2012. PMID: 22880029 Free PMC article.
References
-
- Agarraberes, F. A., and J. F. Dice. 2001. Protein translocation across membranes. Biochim. Biophys. Acta. 1513:1–24. - PubMed
-
- Bayley, H., and C. Cremer. 2001. Stochastic sensors inspired by biology. Nature (Lond.). 413:226–230. - PubMed
-
- Beckmann, R., D. Bubeck, R. Grassucci, P. Penczek, A. Verschoor, G. Blobel, and J. Frank. 1997. Alignment of conduits for the nascent polypeptide chain in the ribosome-Sec61 complex. Science. 278:2123–2126. - PubMed
-
- Beckmann, R., C. M. Spahn, N. Eswar, J. Helmers, P. A. Penczek, A. Sali, J. Frank, and G. Blobel. 2001. Architecture of the protein-conducting channel associated with the translating 80S ribosome. Cell. 107:361–372. - PubMed
Publication types
MeSH terms
Substances
LinkOut - more resources
Full Text Sources
Other Literature Sources
Miscellaneous

