. 2005 May;16(5):2207-17.
doi: 10.1091/mbc.e04-10-0904. Epub 2005 Feb 23.

Local phosphatidylinositol 3,4,5-trisphosphate accumulation recruits Vav2 and Vav3 to activate Rac1/Cdc42 and initiate neurite outgrowth in nerve growth factor-stimulated PC12 cells

Affiliations

Local phosphatidylinositol 3,4,5-trisphosphate accumulation recruits Vav2 and Vav3 to activate Rac1/Cdc42 and initiate neurite outgrowth in nerve growth factor-stimulated PC12 cells

Kazuhiro Aoki et al. Mol Biol Cell. 2005 May.

Abstract

Neurite outgrowth is an important process in the formation of neuronal networks. Rac1 and Cdc42, members of the Rho-family GTPases, positively regulate neurite extension through reorganization of the actin cytoskeleton. Here, we examine the dynamic linkage between Rac1/Cdc42 and phosphatidylinositol 3-kinase (PI3-kinase) during nerve growth factor (NGF)-induced neurite outgrowth in PC12 cells. Activity imaging using fluorescence resonance energy transfer probes showed that PI3-kinase as well as Rac1/Cdc42 was transiently activated in broad areas of the cell periphery immediately after NGF addition. Subsequently, local and repetitive activation of PI3-kinase and Rac1/Cdc42 was observed at the protruding sites. Depletion of Vav2 and Vav3 by RNA interference significantly inhibited both Rac1/Cdc42 activation and the formation of short processes leading to neurite outgrowth. At the NGF-induced protrusions, local phosphatidylinositol 3,4,5-trisphosphate accumulation recruited Vav2 and Vav3 to activate Rac1 and Cdc42, and conversely, Vav2 and Vav3 were required for the local activation of PI3-kinase. These observations demonstrated for the first time that Vav2 and Vav3 are essential constituents of the positive feedback loop that is comprised of PI3-kinase and Rac1/Cdc42 and cycles locally with morphological changes.


Figures

Figure 1.
Figure 1.
Spatiotemporal changes in PIP3 concentration and Rac1/Cdc42/Ras activities upon NGF stimulation. PC12 cells expressing fllip-pm, Raichu-Rac1, Raichu-Cdc42, or Raichu-Ras were starved for 6 h and then treated with 50 ng/ml NGF. Images were obtained every 2 min for 30 min after NGF stimulation. Experiments were repeated at least five times for each probe. Representative ratio images of YFP/CFP at the indicated time points (minutes) after NGF addition are shown in the intensity-modulated display (IMD) mode. In the IMD mode, eight colors from red to blue are used to represent the YFP/CFP ratio, with the intensity of each color indicating the mean intensity of YFP and CFP. The upper and lower limits of the ratio image are shown on the right. Bars, 10 μm.
Figure 2.
Figure 2.
Effect of depletion of Vav2 and Vav3 on NGF-induced activation of Rac1 and Cdc42. (A–D) PC12 cells were transfected with an empty pSUPER vector (A and B) or both pSUPER-Vav2 and pSUPER-Vav3 (C and D). After selection with puromycin, the cells were further transfected with pRaichu-Rac1 (top) or pRaichu-Cdc42 (bottom). After serum starvation for 6 h, images were obtained every 2 min for 30 min after NGF stimulation. In A and C, representative ratio images of YFP/CFP at the indicated time points (minutes) after NGF addition are shown after normalization as follows. First, in each sample, we determined the average ratio over the whole cell before NGF addition and used that ratio as the reference value. Then, the raw YFP/CFP ratio of each pixel was divided by the reference value, and this normalized value was used to generate a normalized ratio image where the upper and lower limits of the ratio range were fixed at 1.15 and 0.85, respectively. Bars, 10 μm. In B and D, YFP/CFP ratios of three representative data sets were expressed by measuring the increase over the reference value used in A and C. Gray zones indicate the initial 10 min after NGF addition. (E) Bar graphs represent peak values of Rac1 (left) and Cdc42 (right) activation in control and knockdown cells. The average of the highest values of fold increase in the YFP/CFP ratio within 10 min of NGF addition is shown with SD. The number of cells examined for each sample was as follows: control (n = 6), Vav2 KD (n = 6), Vav3 KD (n = 5), Vav2/Vav3 KD (n = 7) for Rac1; control (n = 5), Vav2 KD (n = 5), Vav3 KD (n = 5), Vav2/Vav3 KD (n = 5) for Cdc42. The symbols indicate the results of t test analysis; *p < 0.05, **p < 0.01 compared with the control. (F) Control and knockdown cells were starved for 12 h, treated with or without NGF for 2.5 min, and examined by pull-down assay to detect active Rac1 (left) and Cdc42 (right). Experiments were repeated five times, and average values of fold increase compared with mock-treated cells are shown with standard deviations. The symbols indicate the results of t test analysis; *p <0.05 compared with the control. (G) Vav2 and Vav3 expression in control and knockdown cells were analyzed by immunoblotting (for Vav2, top) or RT-PCR analysis (for Vav3, middle). The efficiency of depletion of exogenous Vav3 protein by shRNA was confirmed by immunoblotting (bottom).
Figure 3.
Figure 3.
Effect of depletion of Sos1 and Sos2 on NGF-induced activation of Rac1 and Cdc42. (A–D) PC12 cells were transfected with an empty pSUPER vector (A and B) or both pSUPER-Sos1 and pSUPER-Sos2 (C and D). After puromycin selection, the cells were further transfected with pRaichu-Rac1 (top) or pRaichu-Cdc42 (bottom). After serum starvation, images were obtained every 2 min for 30 min after NGF stimulation. Representative time sequences of normalized ratio images of YFP/CFP (A and C) and line graphs of relative YFP/CFP ratios of three representative data sets (B and D) are shown, as described in the legend of Figure 2, A–D. Bars, 10 μm. (E) Bar graphs represent peak values of Rac1 (left) and Cdc42 (right) activation in control and knockdown cells as in Figure 2E. The number of cells examined for each sample was as follows: control (n = 6), Sos1 KD (n = 5), Sos2 KD (n = 5), Sos1/Sos2 KD (n = 5) for Rac1; control (n = 5), Sos1 KD (n = 7), Sos2 KD (n = 6), Sos1/Sos2 KD (n = 5) for Cdc42. The symbols indicate the results of t test analysis; *p < 0.05 compared with the control. (F) Control and knockdown cells were starved for 12 h, treated with or without NGF for 2.5 min, and examined by pull-down assay to detect active Rac1 (left) and Cdc42 (right). Experiments were repeated three times, and average values of fold increase compared with mock-treated cells are shown with standard deviations. The symbols indicate the results of t test analysis; *p < 0.05 compared with the control. (G) Sos1 and Sos2 expression in control and knockdown cells were analyzed by immunoblotting.
Figure 4.
Figure 4.
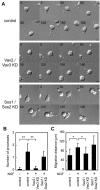
Effect of Vav2/3 or Sos1/2 depletion on the initial morphological change after NGF stimulation. PC12 cells were transfected with an empty pSUPER vector, pSUPER-Vav2 and pSUPER-Vav3, or pSUPER-Sos1 and pSUPER-Sos2. After recovery, the cells were incubated with puromycin for 2 d. After serum starvation, the cells were stimulated with NGF, and DIC images were obtained every 5 min for 3 h. Experiments were repeated at least five times for each sample. (A) Representative images of the control cells (top), Vav2/3-depleted cells (middle), and Sos1/2-depleted cells (bottom) are shown at the indicated time points (minutes) after NGF addition. Bars, 10 μm. (B and C) Quantification of NGF-induced protrusions and migration in control, Vav2/3- or Sos1/2-depleted cells. Bars represent (B) the average of the number of protrusions longer than 10 μm at three time points (1, 2, and 3 h after NGF addition) and (C) the average length of the trajectories of nuclei during 3 h. Control cells without NGF treatment also were examined. The symbols indicate the results of t test analysis; *p < 0.05, **p < 0.01 compared with the control.
Figure 5.
Figure 5.
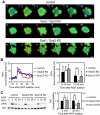
Inhibition of PIP3 accumulation by depletion of Vav2 and Vav3. PC12 cells were transfected with an empty pSUPER vector, both pSUPER-Vav2 and pSUPER-Vav3 or both pSUPER-Sos1 and pSUPER-Sos2. After selection with puromycin, the cells were transfected with the plasmid encoding fllip-pm. After serum starvation for 6 h, images were obtained every 2 min for 30 min after NGF stimulation. (A) Representative time-sequences of normalized ratio images of YFP/CFP are shown as described in the legend to Figure 2,A and C. Bars, 10 μm. (B) PIP3-accumulated area was calculated using MetaMorph software as follows: In each sample, we determined the average ratio over the whole cell before NGF stimulation and used that ratio as the reference value. Then, the percentage of the area where the local YFP/CFP ratio exceeded the reference value by at least 10% was measured at each time point after NGF stimulation. Left, time-dependent changes of the average PIP3-accumulated area of control (n = 5), Vav2/Vav3 KD (n = 5), and Sos1/Sos2 KD (n = 6) cells. Bar graph (right) illustrates the average of PIP3-acculated area with SD for the initial 10-min period and the succeeding 20-min period. The symbols indicate the results of t test analysis; *p < 0.05, **p < 0.01 compared with the control. (C) PC12 cells transfected with pSUPER, both pSUPER-Vav2 and pSUPER-Vav3, or both pSUPER-Sos1 and pSUPER-Sos2 were serum starved and stimulated with NGF for the indicated periods. Cell lysates were immunoblotted with anti-phospho Akt (Thr308) antibody and anti-Akt antibody (left). Akt phosphorylation was expressed as an average of the ratio of each sample to the control cells stimulated for 3 min (right). The symbols indicate the results of t test analysis (*p < 0.05, **p < 0.01; n = 4).
Figure 8.
Figure 8.
Schematic representation of signaling pathway of NGF-induced neurite outgrowth in PC12 cells. In the early phase (0–10 min), global activation of PI3-kinase upon NGF stimulation recruited Vav2 and Vav3 to activate Rac1/Cdc42 in broad areas. Lamellipodial protrusion at the cell periphery was concomitantly observed. Sos1 partially mediated Cdc42 activation only in cell bodies immediately after NGF addition. In the late phase (10–30 min), NGF/TrkA signaling drives a cycling of positive feedback loop comprised of PI3-kinase, Vav2/3, Rac1/Cdc42, and actin cytoskeleton; this feedback loop promotes neurite outgrowth by regulating morphological dynamics.
Figure 6.
Figure 6.
Effect of depletion of Vav2, Vav3, Sos1, or Sos2 on NGF-induced neurite outgrowth. PC12 cells were transfected with the indicated pSUPER constructs and incubated with puromycin for 2 d. Then, the selected cells were cultured with NGF for 60 h and fixed for microscopy. (A) Representative phase contrast images of control cells (left), Vav2/3-depleted cells (middle), and Sos1/2-depleted cells (right). Bars, 10 μm. (B) Cells having neurites whose lengths were twofold longer than their cell body lengths were scored as neurite-bearing cells. At least 60 cells were assessed in each experiment, and the experiments were repeated three times. The results are expressed as the mean percentage of neurite-bearing cells with the SD. The symbols indicate the results of t test analysis; *p < 0.05, **p < 0.01 compared with the control.
Figure 7.
Figure 7.
Membrane recruitment of Vav2 and Vav3 in PC12 cells stimulated with NGF or EGF. (A and B) Serum-starved PC12 cells expressing FLAG-Vav2 or Vav3-HA were pretreated with or without 20 μM LY294002 (Yasui et al., 2001) for 30 min. Then, the cells were mock treated or treated with 50 ng/ml NGF or 50 ng/ml EGF for 2.5 min, and stained with anti-FLAG (for Vav2) or anti-HA (for Vav3) antibody. (A) Representative confocal images of horizontal and vertical sections are shown with scale bars (10 μm). (B) The subcellular distribution of Vav2 and Vav3 was classified into three categories: mainly at the plasma membrane (PM), both at the plasma membrane and cytosol (PM + cytosol), or mainly in the cytosol. Composite bar graphs show the percentage of number of the cells in each category for samples indicated below the graph. At least 30 cells were examined in each sample. (C) PC12 cells were transfected with FLAG-Vav2 or Vav3-HA cDNA. After serum starvation, cells were mock treated or treated with NGF or EGF for 2.5 min. Anti-FLAG immunoprecipitates (left) were immunoblotted with anti-phosphotyrosine or anti-FLAG (for Vav2 detection) antibody. Anti-HA immunoprecipitates (right) were probed with anti-phosphotyrosine or anti-HA (for Vav3 detection) antibody.

Similar articles

Cited by

References

    1. Angelastro, J. M., Klimaschewski, L., Tang, S., Vitolo, O. V., Weissman, T. A., Donlin, L. T., Shelanski, M. L., and Greene, L. A. (2000). Identification of diverse nerve growth factor-regulated genes by serial analysis of gene expression (SAGE) profiling. Proc. Natl. Acad. Sci. USA 97, 10424–10429. - PMC - PubMed
    1. Aoki, K., Nakamura, T., and Matsuda, M. (2004). Spatio-temporal regulation of Rac1 and Cdc42 activity during nerve growth factor-induced neurite outgrowth in PC12 cells. J. Biol. Chem. 279, 713–719. - PubMed
    1. Bibel, M., and Barde, Y. A. (2000). Neurotrophins: key regulators of cell fate and cell shape in the vertebrate nervous system. Genes Dev. 14, 2919–2937. - PubMed
    1. Bourne, H. R., and Weiner, O. (2002). A chemical compass. Nature 419, 21. - PubMed
    1. Brummelkamp, T. R., Bernards, R., and Agami, R. (2002). A system for stable expression of short interfering RNAs in mammalian cells. Science 296, 550–553. - PubMed

Publication types

MeSH terms