

Structure and dynamics of model pore insertion into a membrane
- PMID: 15722425
- PMCID: PMC1305460
- DOI: 10.1529/biophysj.104.053769
Structure and dynamics of model pore insertion into a membrane
Abstract
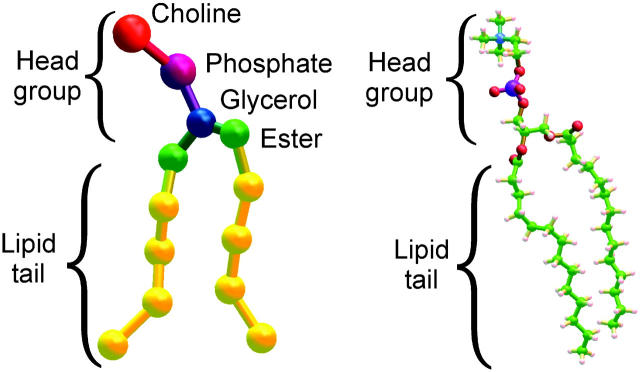
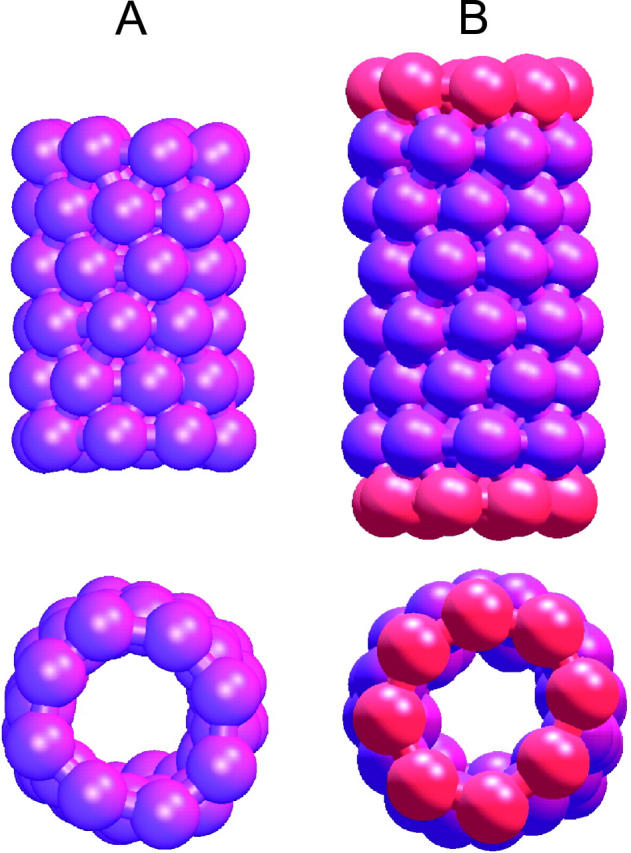
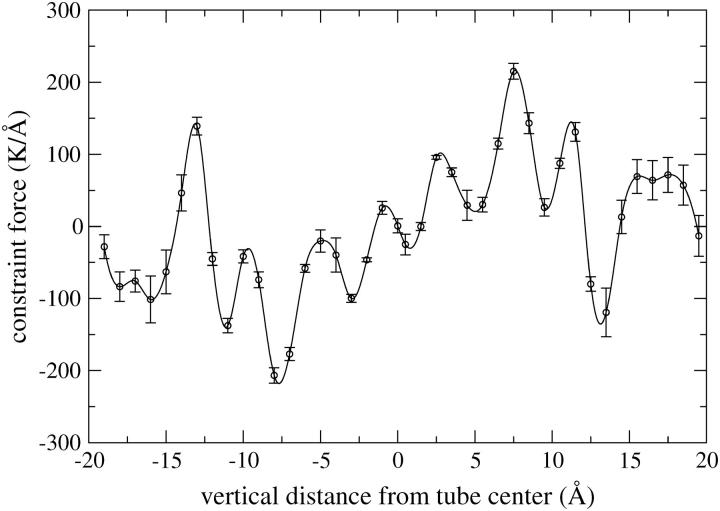
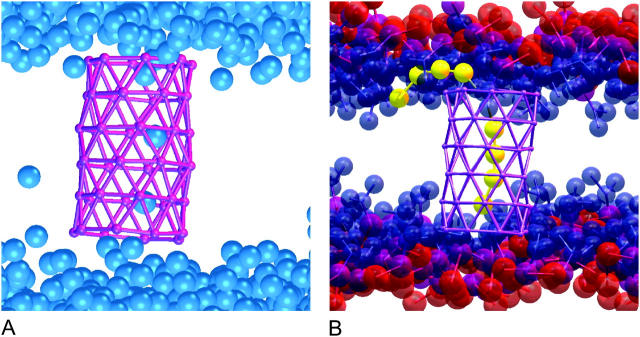
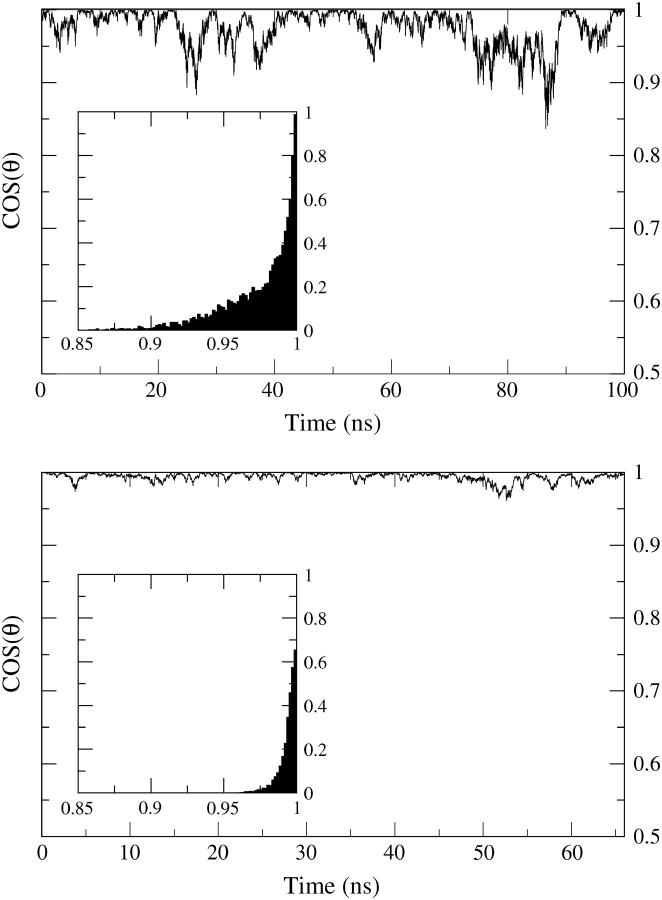
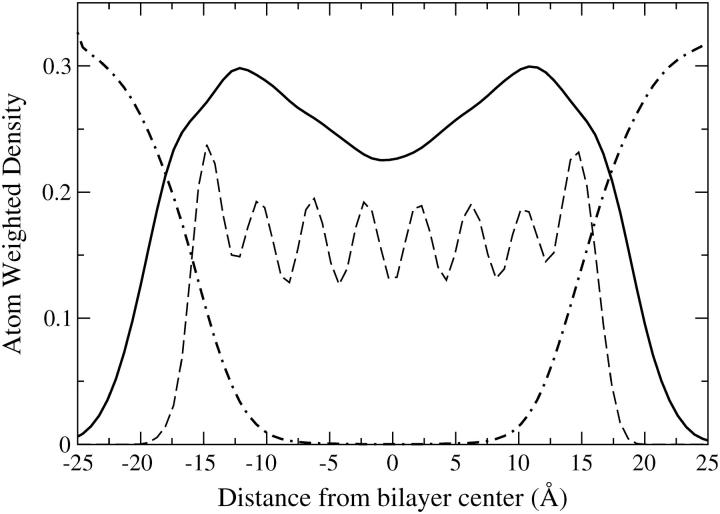
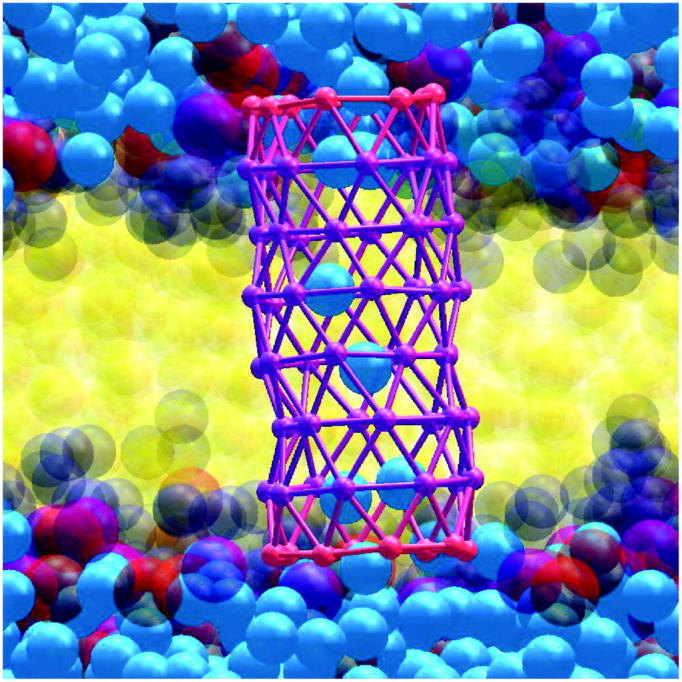
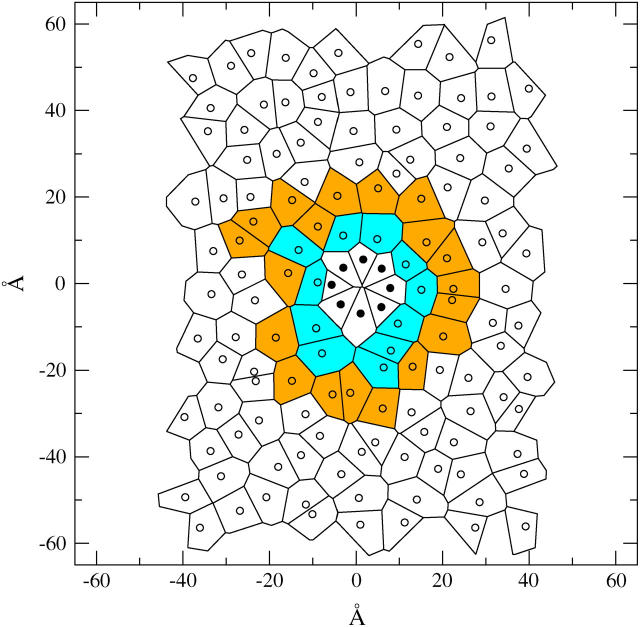
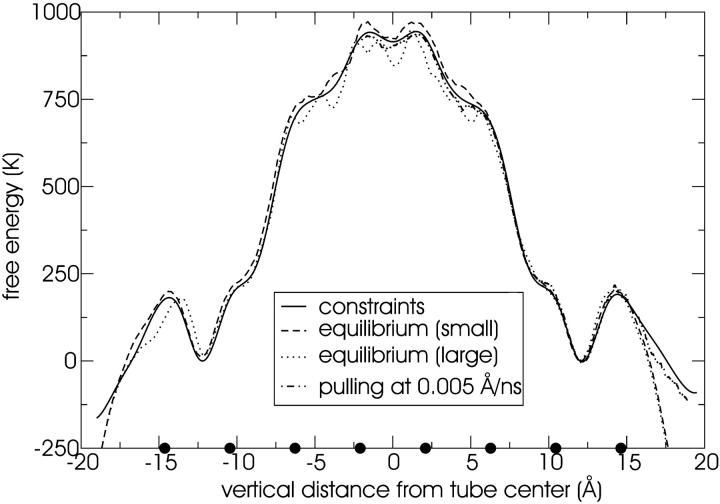
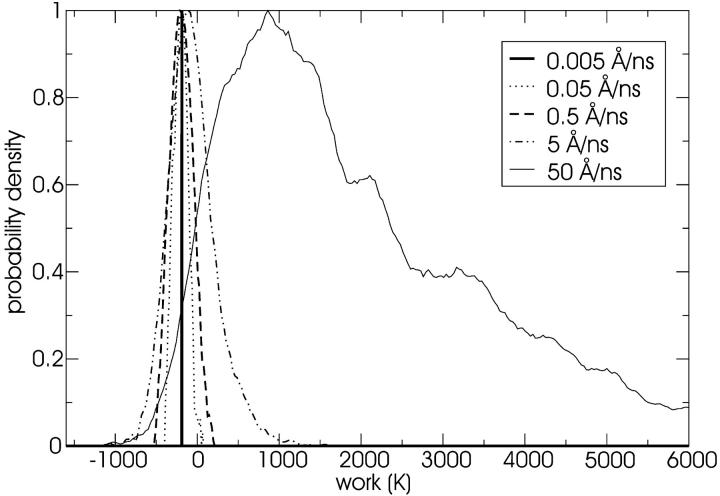
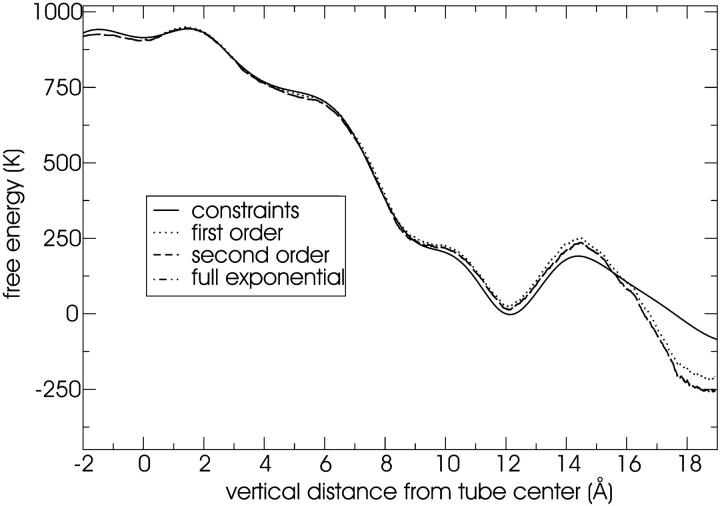
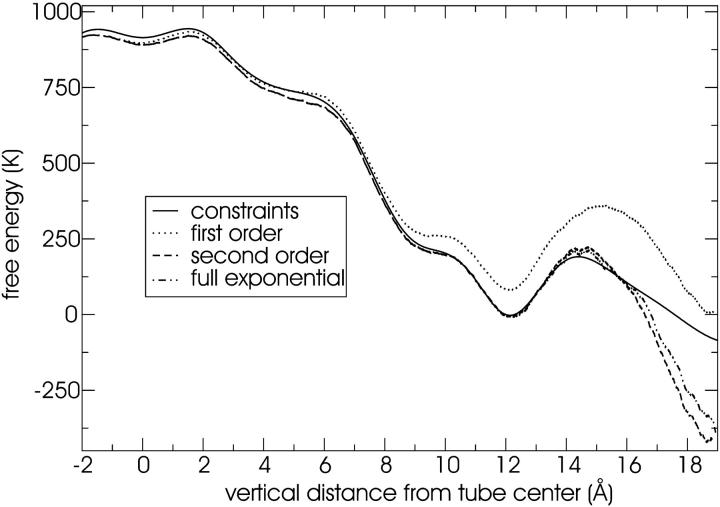
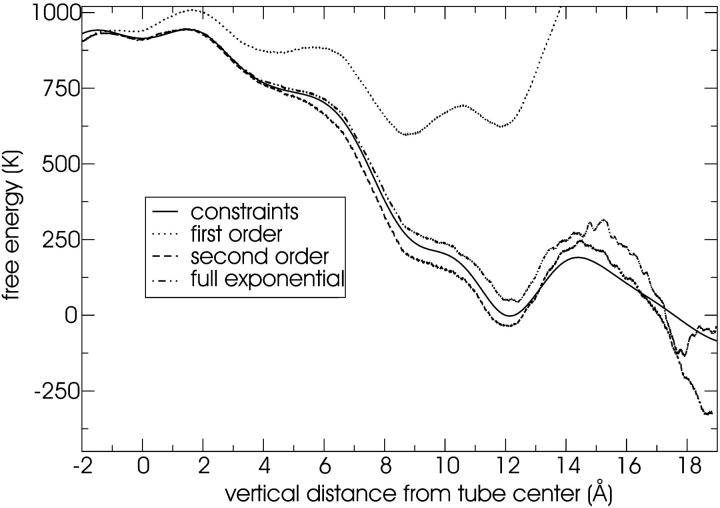
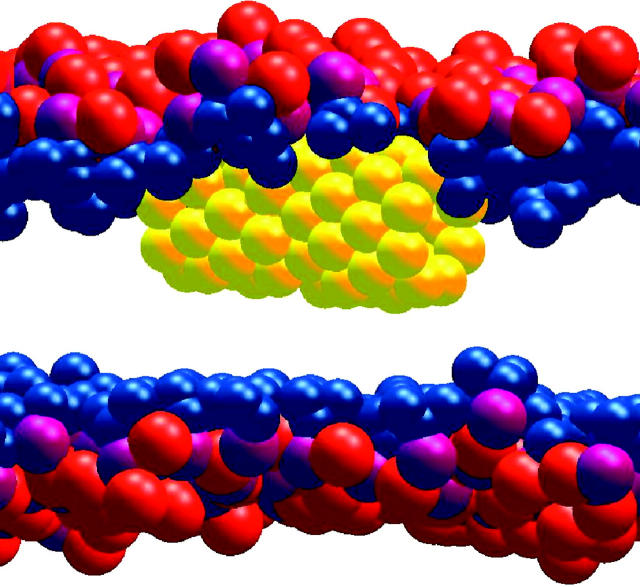
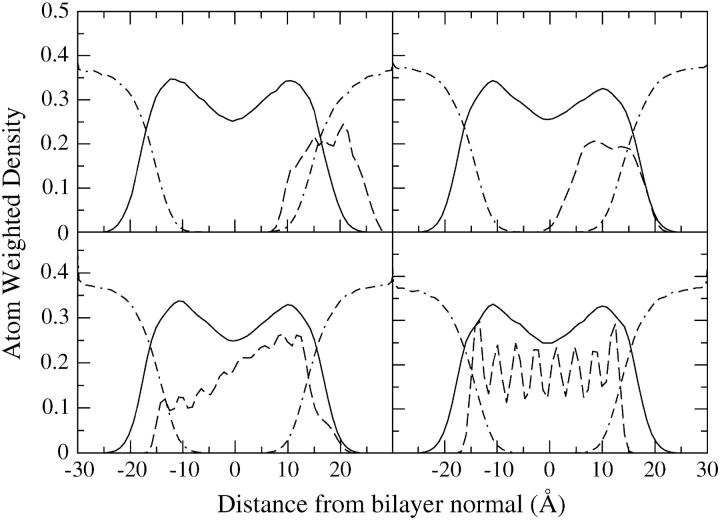
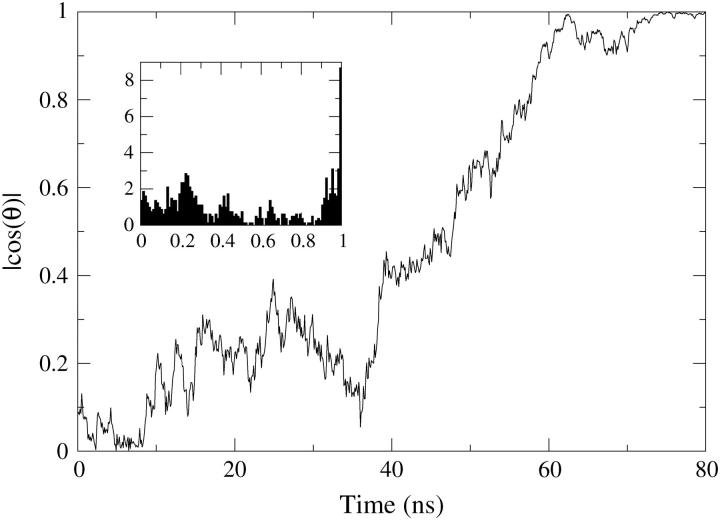
A cylindrical transmembrane molecule is constructed by linking hydrophobic sites selected from a coarse grain model. The resulting hollow tube assembly serves as a representation of a transmembrane channel, pore, or a carbon nanotube. The interactions of a coarse grain di-myristoyl-phosphatidyl-choline hydrated bilayer with both a purely hydrophobic tube and a tube with hydrophilic caps are studied. The hydrophobic tube rotates in the membrane and becomes blocked by lipid tails after a few tens of nanoseconds. The hydrophilic sites of the capped tube stabilize it by anchoring the tube in the lipid headgroup/water interfacial region of each membrane leaflet. The capped tube remains free of lipid tails. The capped tube spontaneously conducts coarse grain water sites; the free-energy profile of this process is calculated using three different methods and is compared to the barrier for water permeation through the lipid bilayer. Spontaneous tube insertion into an undisturbed lipid bilayer is also studied, which we reported briefly in a previous publication. The hydrophobic tube submerges into the membrane core in a carpetlike manner. The capped tube laterally fuses with the closest leaflet, and then, after plunging into the membrane interior, rotates to assume a transbilayer orientation. Two lipids become trapped at the end of the tube as it penetrates the membrane. The hydrophilic headgroups of these lipids associate with the lower tube cap and assist the tube in crossing the interior of the membrane. When the rotation is complete these lipids detach from the tube caps and fuse with the lower leaflet lipids.
Figures

Similar articles
-
Transmembrane peptide-induced lipid sorting and mechanism of Lalpha-to-inverted phase transition using coarse-grain molecular dynamics.Biophys J. 2004 Oct;87(4):2107-15. doi: 10.1529/biophysj.104.040311. Biophys J. 2004. PMID: 15454415 Free PMC article.
-
Lipid bilayer perturbations around a transmembrane nanotube: a coarse grain molecular dynamics study.Biophys J. 2005 Jun;88(6):3822-8. doi: 10.1529/biophysj.104.057703. Epub 2005 Mar 18. Biophys J. 2005. PMID: 15778436 Free PMC article.
-
Diffusion and spectroscopy of water and lipids in fully hydrated dimyristoylphosphatidylcholine bilayer membranes.J Chem Phys. 2014 Mar 14;140(10):104901. doi: 10.1063/1.4867385. J Chem Phys. 2014. PMID: 24628199
-
Bilayer thickness and membrane protein function: an energetic perspective.Annu Rev Biophys Biomol Struct. 2007;36:107-30. doi: 10.1146/annurev.biophys.36.040306.132643. Annu Rev Biophys Biomol Struct. 2007. PMID: 17263662 Review.
-
Permeability of water and polar solutes in lipid bilayers.Adv Colloid Interface Sci. 1988 Jul;29(1-2):141-70. doi: 10.1016/0001-8686(88)80004-6. Adv Colloid Interface Sci. 1988. PMID: 3078140 Review.
Cited by
-
Orientation of the monomeric porin OmpG in planar lipid bilayers.Chembiochem. 2008 Dec 15;9(18):3029-36. doi: 10.1002/cbic.200800444. Chembiochem. 2008. PMID: 19012294 Free PMC article.
-
Interaction of diverse voltage sensor homologs with lipid bilayers revealed by self-assembly simulations.Biophys J. 2011 Feb 16;100(4):875-84. doi: 10.1016/j.bpj.2010.11.049. Biophys J. 2011. PMID: 21320431 Free PMC article.
-
Polystyrene-modified carbon nanotubes: Promising carriers in targeted drug delivery.Biophys J. 2022 Nov 15;121(22):4271-4279. doi: 10.1016/j.bpj.2022.10.014. Epub 2022 Oct 13. Biophys J. 2022. PMID: 36230001 Free PMC article.
-
Computational modeling of poly(alkylthiophene) conductive polymer insertion into phospholipid bilayers.Langmuir. 2007 Oct 9;23(21):10672-81. doi: 10.1021/la070214v. Epub 2007 Sep 15. Langmuir. 2007. PMID: 17867709 Free PMC article.
-
Modeling Transport Through Synthetic Nanopores.IEEE Nanotechnol Mag. 2009 Mar;3(1):20-28. doi: 10.1109/MNANO.2008.931112. IEEE Nanotechnol Mag. 2009. PMID: 21909347 Free PMC article.
References
-
- Andreu, D., and L. Rivas. 1998. Animal antimicrobial peptides: an overview. Biopolymers. 47:415–433. - PubMed
-
- Bayley, H. 1999. Designed membrane channels and pores. Curr. Opin. Biotechnol. 10:94–103. - PubMed
-
- Beckstein, O., P. C. Biggin, and M. S. P. Sansom. 2001. A hydrophobic gating mechanism for nanopores. J. Phys. Chem. B. 105:12902–12905.
Publication types
MeSH terms
Substances
Grants and funding
LinkOut - more resources
Full Text Sources
Other Literature Sources
Miscellaneous
